Hi, what do you want to do?
Curated OER
Using Pictographs With Data
In this using pictographs with data worksheet, 3rd graders read data from a pictograph to answer ten multiple choice questions. Answers can be shown on the screen.
Curated OER
What's Your Favorite Season?
Students collect data on the favorite seasons. In this data collection and analysis lesson, students learn about displaying data on charts and graphs. They collect data about the favorite seasons of the children in their class and...
Curated OER
Making a Pictograph
In this pictograph worksheet, students use a picture to make a pictograph, then solve 2 related problems. Students also complete a "Test Prep" question about the graph.
Curated OER
Favorite Prize
In this graphing worksheet, students focus on the usage of a pictograph. Students poll classmates and respond to 2 questions about the graph that they have created.
Curated OER
Numeracy Practice Math Sports
In this math worksheet, students match the pictographs to find the quantities and write each number sentence. They use the operation of addition.
Curated OER
Bar Charts and Pictographs: How can they help us?
First graders work with manipulatives to solve various math problems by using concrete objects to solve a list of problems . They create and evaluate bar graphs and write a statement about the information on their bar graph.
Curated OER
Creating Stories Using Pictographs
Learners participate in diverse cultural activities that lead them to a better understanding of Native American people. They use pictographs to write a story, imagining themselves as tribal members. Students transfer their story to a...
Curated OER
Lucky Charms Pictograph
Third graders create pictographs using a breakfast cereal. This fun, hands-on lesson allows students to use Lucky Charms cereal to create a pictograph. When the lesson is through, 3rd graders get to eat their Lucky Charms marshmallows.
Curated OER
Organizing Data Using Tables and Graphs
Students create graphs and tables, as well as interpret and make inferences from the data shown to determine when and where graphs and tables are most useful.
Curated OER
Nine Examples for Tables, Pictographs, Mean. Median, and Mode
For this graphical representation of data and measures of central tendency worksheet, learners calculate mean, median, and mode and answer questions related to graphs, tables, and pictographs.
Fuel the Brain
Egg Hunt Pictograph
If you did a hypothetical egg hunt in class, wouldn't it be great to see how many eggs were collected? Your youngsters will receive a list of "collected data" and create a pictograph.
Curated OER
Squigly's Secret Code
For this literacy worksheet, students work to unscramble the secret code. The code is written in symbols that are similar to pictographs.
Curated OER
Bald Eagle Population Graphing
Young scholars create graphs to illustrate the bald eagle population. They identify the population of bald eagles in Minnesota and the United States. They create three graphs to represent the population data including a line, bar, and...
Curated OER
Gone Fishing
Students particapate in a instructional activity on pictographs describing different fish. They observe the columns in the pictographs in order to determine which ones have the most fish and different types of fish. They create their...
Curated OER
Timed Multiplication Test Graphs
Students use the tools of data analysis for managing information. They solve problems by generating, collecting, organizing, displaying histograms on bar graphs, circle graphs, line graphs, pictographs and charts. Students determine...
Curated OER
Graph Your Foot!
Students measure their own foot and place the outline on a graph. They make connections between the size of their foot and the bar graph that represents it.
Curated OER
Ancient Mesopotamia
Students locate ancient Mesopotamia on a map. They examine the religion, government and the development of writing. They write and draw pictographs and cuneiform writing. They create a class book based on their investigations.
National Endowment for the Humanities
Neh: Edsit Ement: Cave Art Discovering Prehistoric Humans
By studying cave paintings, students learn about prehistoric cultures and the stories and ideas they wished to communicate to others through art. The lesson plan presented on this website aims to show young students the significance of...
University of Saskatchewan (Canada)
Northern Research Portal: "Art and Artists" Exhibit
The Inuit and First Nations people tended to express their culture and history through artistic expression. Highlighted is the various art forms and artists of these people and especially the Northern region of Canada. Included are...
Cuemath
Cuemath: Pictographs
A comprehensive guide for learning all about pictographs with definitions, solved examples, and practice questions.
Library of Congress
Loc: The Huexotzinco Codex
Students will analyze a set of pictograph documents created by native peoples of Puebla, Mexico in 1531. Students will take on the role of historians, study the documents, and create a scenario to explain what these documents were for,...
Other
The History of Writing
This explanation of the history of writing traces writing from the use of "Counting tokens," to the development of the Roman alphabet. The pictures of how writing has progressed over time is very interesting and helpful.
American Geosciences Institute
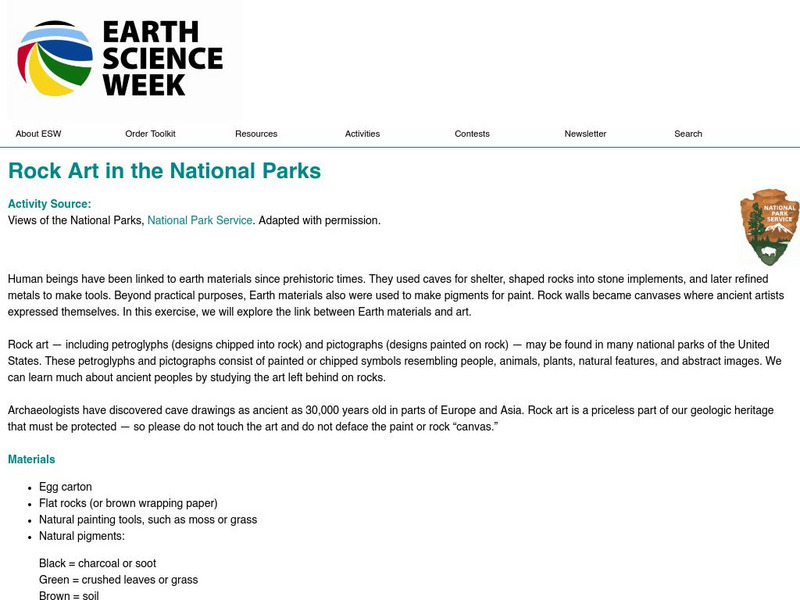
American Geosciences Institute: Earth Science Week: Rock Art in the National Parks
Students learn the importance of protecting pictographs as part of their geologic heritage by making their own paint using natural ingredients to create art.
Khan Academy
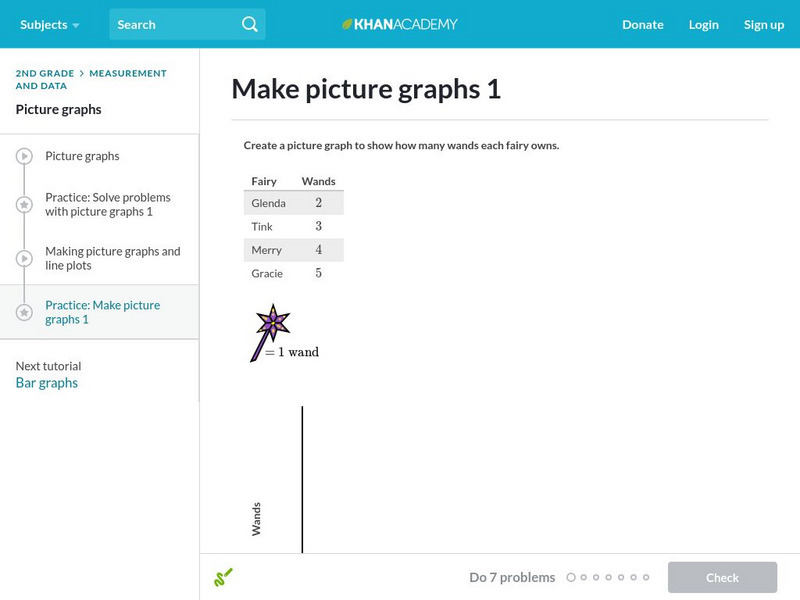
Khan Academy: Make Picture Graphs 1
Practice creating picture graphs (pictographs) from data sets. Students receive immediate feedback and have the opportunity to try questions repeatedly, watch a video or receive hints.


