PBS
How Ancient Art Captured Australian Megafauna
Beneath layers of rock art are drawings of animals SO strange that, for a long time, some anthropologists thought they could only have been imagined. But what if these animals really had existed, after all?
Curated Video
Review of Charts, Graphs, and Line Plots
Mr. Addit reviews the line plot, tally chart, pictogram, and bar graph. He presents word problems to solve using the data from each.
Curated Video
Pictographs
Mr. Addit reviews the tally chart and then explains that data can also be represented by a pictograph. He then reviews the elements of a pictograph and shows how to read and create one.
Curated Video
Review for You: Representing and Analyzing Data
Mr. Addit reviews multiple ways to represent and analyze data, including tallies, bar graphs, pictographs, and line plots.
Curated Video
The Histogram
Mr. Addit introduces a new kind of graph, the histogram. He explains that to create a histogram, we begin with a frequency table and graph our data based upon frequency.
Curated Video
Collect Data
Mr. Addit reviews three kinds of charts and graphs: the tally chart, the pictograph, and the bar graph.
Curated Video
News at Five
The video “News at Five” makes a pictograph using information found on a weather map.
Curated Video
Reading a Pictograph
“Reading a Pictograph” explores tally charts and how to interpret pictograph data to answer questions.
Curated Video
Create a Pictograph
A video entitled “Create a Pictograph” which shows how data can be collected through a survey and displayed on a pictograph.
Curated Video
Creating a People Graph in Microsoft Excel
In this fast-paced tutorial I'll show you how to create visually engaging people graphs in Microsoft Excel.
Makematic
Foot Traffic
People measure all types of things everyday: distances walked, sizes of clothing, quantities of food and time for cooking. In this activity, children aged 3-7 will trace their feet and cut them out to use as non-standard measurements,...
Curated Video
Drawing Pictographs
Draw a scaled pictograph to represent data with several categories.
Curated OER
Image Keys for Pictographs
Play this clip for your 1st or 2nd graders and they'll have no problem understanding how to read a pictograph. This clip is easy to follow and fully explains what an image key is and how it is used to read a pictograph. Great classroom...
Khan Academy
Khan Academy: Making Picture Graphs and Line Plots
Watch this video demonstration of how to make picture graphs and line plots. Includes a video, transcript, and question and answer section. [3:08]
Khan Academy
Khan Academy: Creating Picture and Bar Graphs 1
Sal creates and interprets bar and picture graphs. Includes a video, transcript, and question and answer section. [4:57]
Khan Academy
Khan Academy: Create Picture and Bar Graphs 1
Demonstrates how to make bar and picture graphs and then read them. [4:57]
Khan Academy
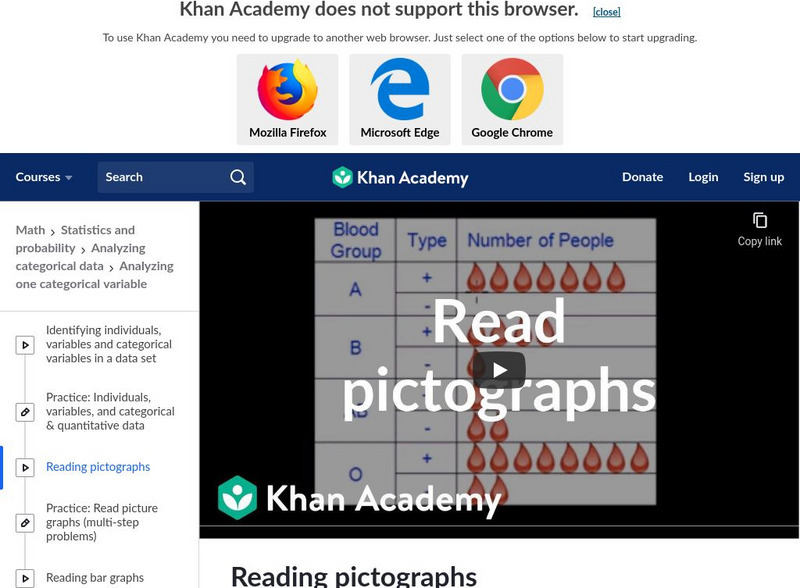
Khan Academy: Reading and Interpreting Data: Reading Pictographs
Video example of reading a pictograph to answer a question including using a scale.
Khan Academy
Khan Academy: Picture Graphs
A picture graph, or pictograph, is a graph used to display information that uses images or symbols to represent data. This video demonstrates how to interpret a pictograph of where mice live on a farm. Includes a video, transcript, and...
Khan Academy
Khan Academy: Solving Problems With Pictographs 2
Sal Khan uses picture graphs to solve word problems. [3:38]
Khan Academy
Khan Academy: Interpreting Picture Graphs: Paint
Lindsay from Khan Academy solves a multi-step word problem involving a picture graph. [1:22]
Khan Academy
Khan Academy: Interpreting Picture Graphs: Notebook
Lindsay from Khan Academy solves a multi-step word problem involving a picture graph. [3:44]
Sophia Learning
Sophia: Creating a Category Pictograph: Lesson 6
This video lesson [4:02] demonstrates how to construct a category pictograph. It is 6 of 8 in the series titled "Creating a Category Pictograph."
Sophia Learning
Sophia: Creating a Category Pictograph: Lesson 1
This video lesson [4:03] demonstrates how to construct a category pictograph. It is 1 of 8 in the series titled "Creating a Category Pictograph."
Sophia Learning
Sophia: Creating a Quantity Pictograph: Lesson 5
This video lesson [3:46] demonstrates how to create a quantity pictogram. It is 5 of 9 in the series titled "Creating a Quantity Pictograph."


