PBS
Pbs Learning Media: Real Life Math: Baseball
Watch and listen as the assistant general manager of a major league baseball team explains how he uses math in this video from KAET, Arizona PBS. A lesson plan and handouts are included. [7:43]
National Science Foundation
National Science Foundation: Science of Nhl Hockey: Statistics & Averages
In order to be the best at their game, an NHL goalie must understand the statistics of their performance, and of their competition, e.g., the goalie save percentage and the goals against average. [5:56]
Khan Academy
Khan Academy: Statistics: Box and Whisker Plots
Video demonstrating the creating of a box-and-whisker plot to analyze data. Includes link to practice problems. [10:05]
Virtual Nerd
Virtual Nerd: What Is the Median of a Data Set?
The median is one of many measures of central tendency. Watch this tutorial to learn what the median is and how to find it. [5:11]
Virtual Nerd
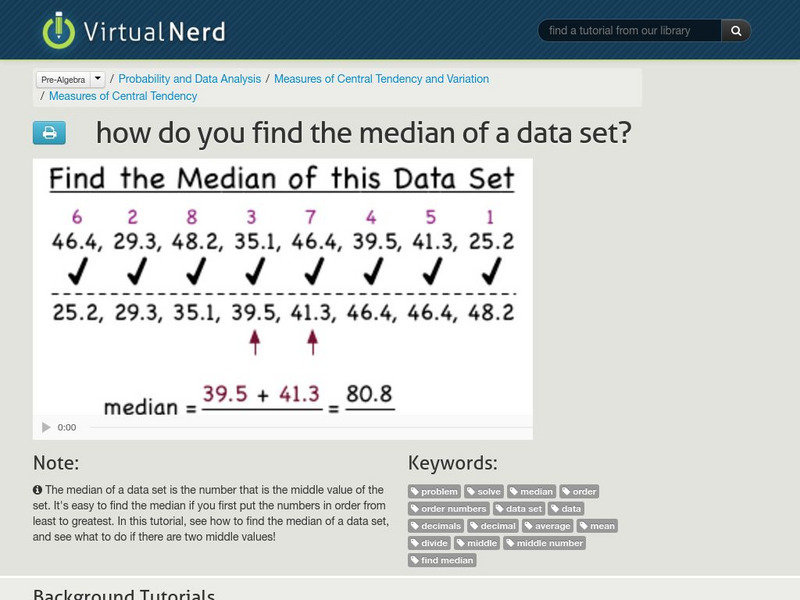
Virtual Nerd: How Do You Find the Median of a Data Set?
The median of a data set is the number that is the middle value of the set. You can find this by putting the numbers in order from least to greatest. Watch this tutorial to see how to find the median of a data set. [3:53]
Math Playground
Math Playground: Can a Set of Data Have More Than One Mode?
This video first defines mean, median and mode. It then answers the question can a set of data have more than one mode.
Khan Academy
Khan Academy: Mean, Median, & Mode Example
The video gives a data set and describes how to find the mean, median, and mode.
Khan Academy
Khan Academy: Statistics Intro: Mean, Median, & Mode
The video introduces statistics and explains the three different ways to describe the center of a data set.
Annenberg Foundation
Annenberg Learner: Against All Odds: Measures of Center
It's helpful to know the center of a distribution, which is what the clerical workers in Colorado Springs found out in the 1980s when they campaigned for comparable wages for comparable work. Mean and median are two different ways to...
Khan Academy
Khan Academy: Triangles: Proving That the Centroid Is 2 3 Rds Along the Median
This video demonstrates that the centroid divides each median into segments with a 2:1 ratio (or that the centroid is 2/3 along the median).
Khan Academy
Khan Academy: Triangles: Exploring Medial Triangles
This video explains what a medial triangle is and proves that the medial triangle divides the original triangle into four congruent triangles.
Khan Academy
Khan Academy: Statistics: Average
Video briefly talks about types of statistics. Gives demonstration of how to find arithmetic mean, median and mode of a set of numbers. Discusses how well each measure represents the data set. Includes link to practice problems. [12:34]
Khan Academy
Khan Academy: Statistics: The Average
Introduction to descriptive statistics and central tendency. Gives demonstration of how to find arithmetic mean, median and mode of a set of numbers.
Khan Academy
Khan Academy: Medians and Centroids: Triangle Medians and Centroids (2 D Proof)
This video shows that the centroid is 2/3 of the way along a median.
Khan Academy
Khan Academy: Measures of Central Tendency: Exploring Mean and Median Module
This video explores the difference between the mean and the median.
Sophia Learning
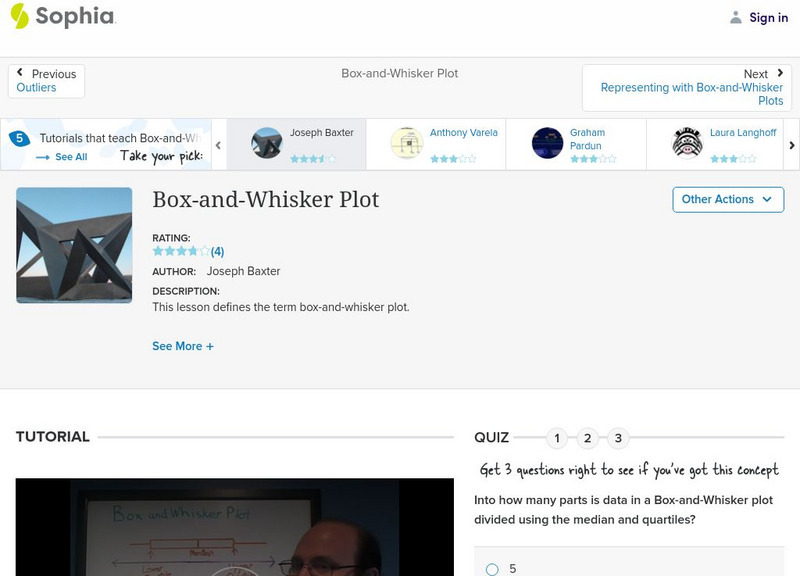
Sophia: Box and Whisker Plot
Box-and-whisker plots are explored in this video tutorial. The lesson reviews how to set up the graph and labels the parts of a box-and-whisker plot.
Sophia Learning
Sophia: Box and Whisker Plots
Box-and-whisker plots are explored in this tutorial. The lesson provides a PowerPoint presentation that defines the terms involved and a video lesson that demonstrates how to create a box-and-whisker plot.
Sophia Learning
Sophia: Finding Mean, Median, and Mode
Explore mean, median, and mode and how to solve for them. Assess learning with a quiz.
Sophia Learning
Sophia: Measures of Central Tendencies
This tutorial provides definitions and describes how to solve for the mean, median, and mode of a data set. It includes a PowerPoint with real-world examples of mean, median, and mode.
Sophia Learning
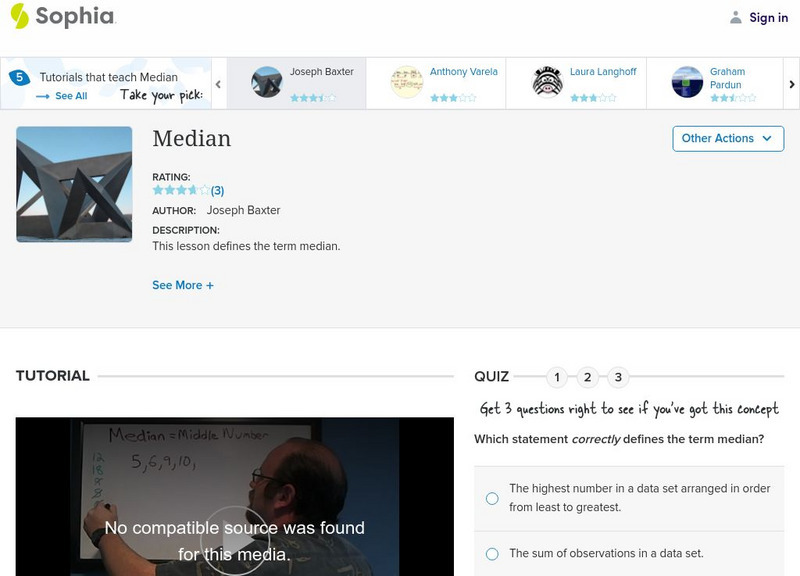
Sophia: Median Tutorial
Place data in numerical order to determine the median. Assessment to follow to determine understanding.
Math Mammoth
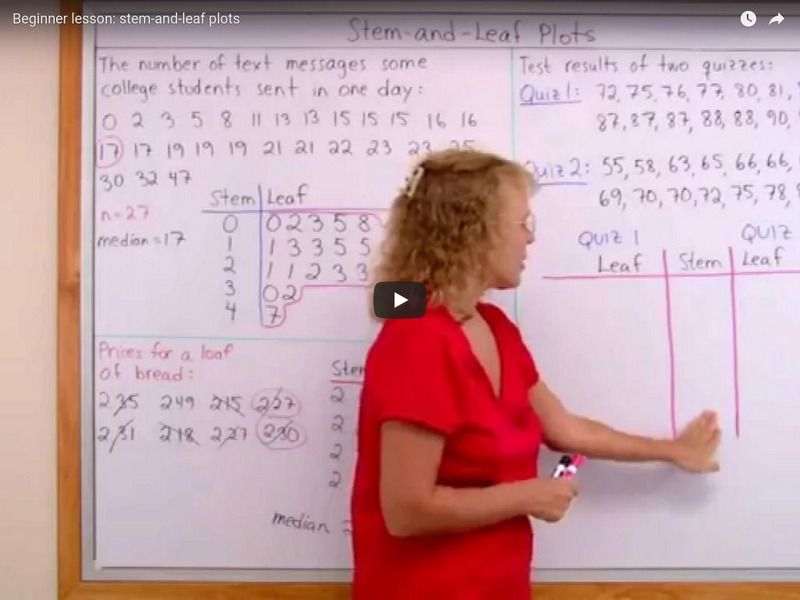
Math Mammoth: Beginner Lesson: Stem and Leaf Plots
Demonstrates how to make stem-and-leaf plots, what the median is, and how to observe the distribution of the data. [9:57]
Math Mammoth
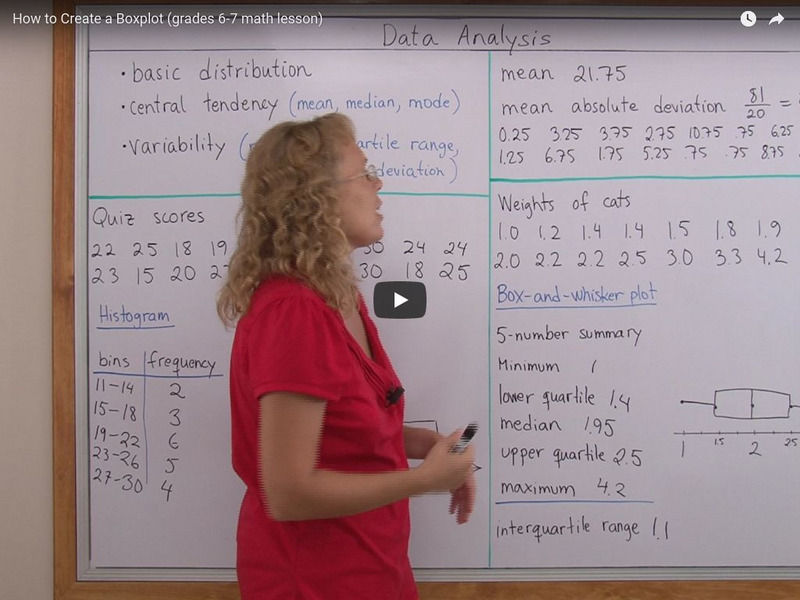
Math Mammoth: How to Create a Boxplot
This lesson explains how to draw a box-and-whisker or box plot, and the terms used to describe one. [4:30]
Crash Course
Crash Course Statistics #3: Measures of Central Tendency
This episode talks about measures of central tendency - those are the numbers that tend to hang out in the middle of our data: the mean, the median, and mode. All of these numbers can be called "averages" and they're the numbers we tend...
Khan Academy
Khan Academy: Statistics: Reading Box and Whisker Plots
Video demonstration of reading a box-and-whisker plot to find the range, median and quartiles and to answer a question. [3:18]


