Hi, what do you want to do?
Sophia Learning
Sophia: Using Different Measures of Central Tendency: Lesson 4
This lesson demonstrates how the different measures of central tendency can cause you to look at data differently. It is 4 of 5 in the series titled "Using Different Measures of Central Tendency."
ClassFlow
Class Flow: Statistics Landmarks Vote
[Free Registration/Login Required] This lesson uses clustering to explore the concept of mean, median, and mode of a set of data and calculates the arithmetic mean.
Free Math Help
Free Math Help: Arithmetic Mean
Students learn how to find the arithmetic mean of data. The tutorial consists of a definition and examples with detailed solutions.
Varsity Tutors
Varsity Tutors: Hotmath: Algebra Review: Mode, Mean and Median
Find a quick, concise explanation of a mode. An example is given and clearly explained. Mean and median are also explained.
ClassFlow
Class Flow: Analyzing Data Mean, Median and Mode
[Free Registration/Login Required] Explores ways of analyzing data in a table.
ClassFlow
Class Flow: Averages Handling Data
[Free Registration/Login Required] This is a dynamic flipchart displaying and using measures of central tendency- mean, medium, mode, and average. Pictures capture the eye, for sure.
ClassFlow
Class Flow: Mean, Median, and Mode
[Free Registration/Login Required] This flipchart contains a video, notes, and rolling dice activity on mean, median and mode.
ClassFlow
Class Flow: Mean, Median, Mode
[Free Registration/Login Required] Use this flipchart to help teach your students about Mean, Median, and Mode. Be ready to pull out the random number generator. Your students will be fully engaged as the dice are rolling.
ClassFlow
Class Flow: Mean, Median, Mode and Range
[Free Registration/Login Required] This interactive flipchart provides an overview of mean, median, mode, and range.
ClassFlow
Class Flow: Mean, Median, Mode, and Range
[Free Registration/Login Required] This flipchart describes the basics of mean, median, mode, and range.
Math Is Fun
Math Is Fun: How to Find the Mean
This math tutorial illustrates the mean of a set of data.
ClassFlow
Class Flow: Mean, Mode, Median, and Range
[Free Registration/Login Required] This is a flipchart about mean, mode, median, and range. It also has an assessment using Activotes.
Math Is Fun
Math Is Fun: The Mean Machine
This little tool lets you type in your numbers from your data collection, and it will calculate the mean value for you.
Math Slice
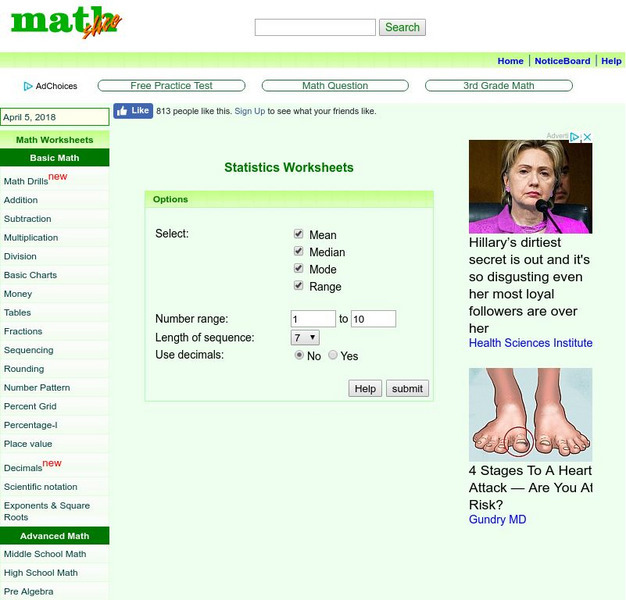
Math Slice: Statistics: Math Worksheets
This tool allows you to create worksheets where students calculate the mean, median, mode or range of a set of numbers.
That Quiz
That Quiz: Medias
This interactive activity is designed as a review to the concept of mean, median and mode.
Purple Math
Purplemath: Proportions: Introduction
Explains the basics and terminology of proportions.
University of Illinois
University of Illinois: Rollin' Rollin' Rollin'
This resource is the beginning of a series of pages that demonstrates the diffference between the mean and median of a group of numbers. Uses bar graphs to display the data.
University of Illinois
University of Illinois: Home, Home on the Range
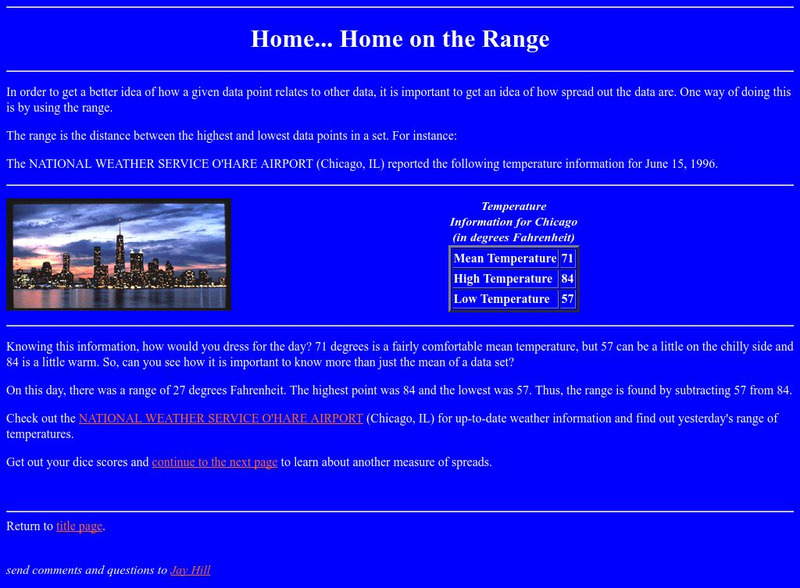
This site from the University of Illinois contains an introduction and definition of the term range. It has a link to the National Weather Service so students can practice finding the range using the available weather data.
Other
Meta Calculator: Statistics Calculator
A web-based statistics calculator to find mean, median, standard deviation, variance and ranges.
BBC
Bbc: Standard Deviation
A demonstration of how to find the standard deviation of a set of data. Several examples and a practice test are offered.
Math Is Fun
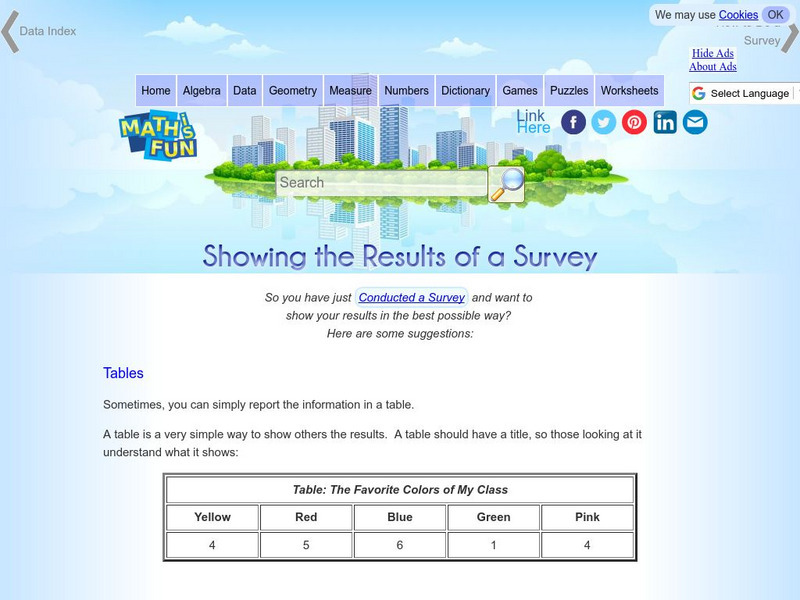
Math Is Fun: Showing the Results of a Survey
A variety of ways to display the results of a survey are listed, including tables, statistics and different types of graphs.
BBC
Bbc Bitesize: How to Find Mean, Median, Mode, and Range
This ten question quiz will help you assess your understanding of mean, median, and mode. Links are provided that allow you to enlarge the quiz to fit your full screen, see the quiz in a different format, review the definitions of mean,...
Free Math Help
Free Math Help: Batting Average
Here is an explanation about how to calculate a player's batting average.
Education Place
Houghton Mifflin: Eduplace: Extra Practice Quiz Mean, Median, Mode, Range 2
Practice using the graph to answer questions about the mean, median, mode and range. Read the interactive quiz rules and then click on the "Begin" ticket. If you answer incorrectly you get one more chance to try again then you are told...


