NC State University
Nc State University: 4.2 (Cont.) Expected Value of a Discrete Random Variable
A PowerPoint explaining and showing examples of how to measure the mean of the values of a random variable.
Khan Academy
Khan Academy: Mean (Expected Value) of a Discrete Random Variable Practice
A practice word problem asking students to calculate the mean of B in a probability chart.
Purple Math
Purplemath: Mean, Median, Mode, and Range
Mean, median, and mode are three kinds of "averages". The "mean" is the "average" you're used to, where you add up all the numbers and then divide by the number of numbers. The "median" is the "middle" value in the list of numbers. To...
Palomar Community College District
Palomar College: Mode, Median, Mean Examples
A series of step-by-step worked problems demonstrating how to take a set of data and produce the measures of central tendency. Hints are provided along the way and the final measures are shown for the user to check.
CK-12 Foundation
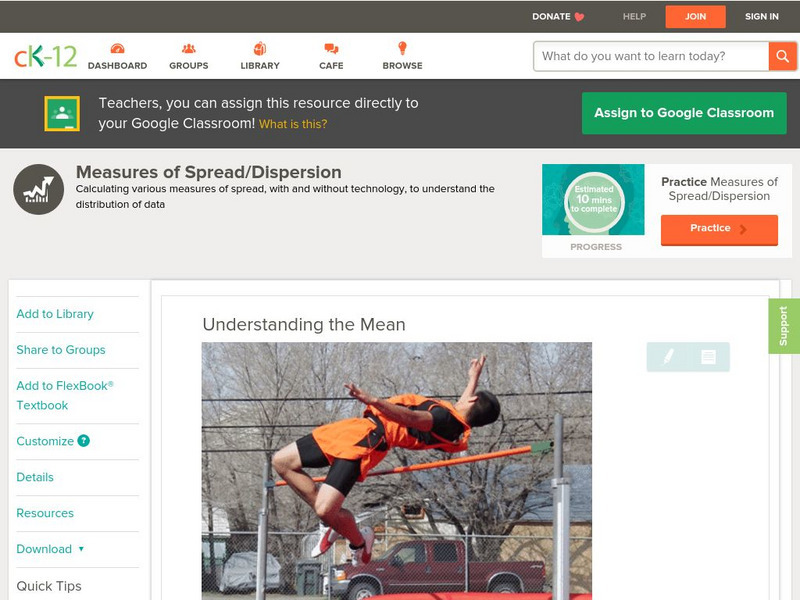
Ck 12: Statistics: Measures of Spread/dispersion Grade 8
[Free Registration/Login may be required to access all resource tools.] Understanding the mean and statistical deviations.
CK-12 Foundation
Ck 12: Summary Statistics: Summarizing Univariate Distributions
[Free Registration/Login may be required to access all resource tools.] This concept teaches students about other measures of center such as the mid-range, trimmed means and weighted mean. It also introduces the concept of percentiles,...
CK-12 Foundation
Ck 12: Mean and Standard Deviation of Discrete Random Variables
[Free Registration/Login may be required to access all resource tools.] This Concept teaches students how to find the mean and standard deviation for discrete random variables.
CK-12 Foundation
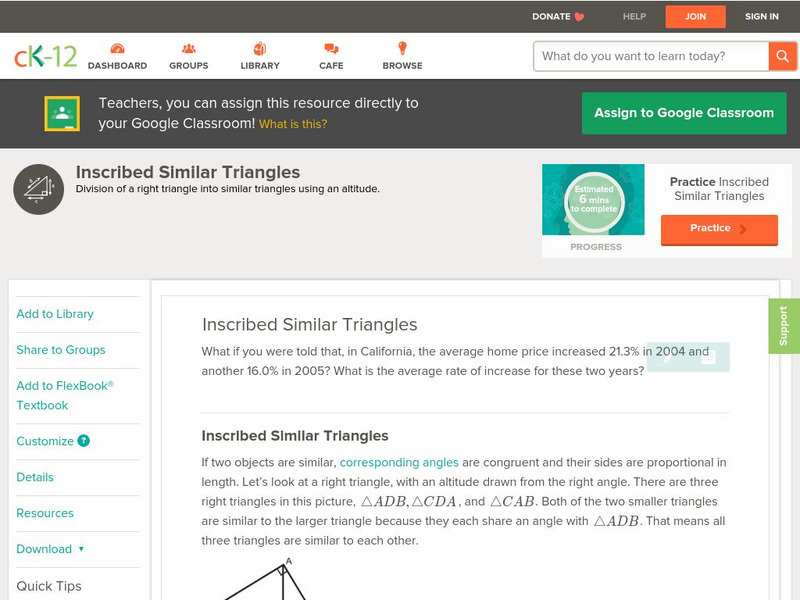
Ck 12: Geometry: Inscribed Similar Triangles
[Free Registration/Login may be required to access all resource tools.] This concept teaches students how to apply similarity to solve for missing information in inscribed right triangles.
Beacon Learning Center
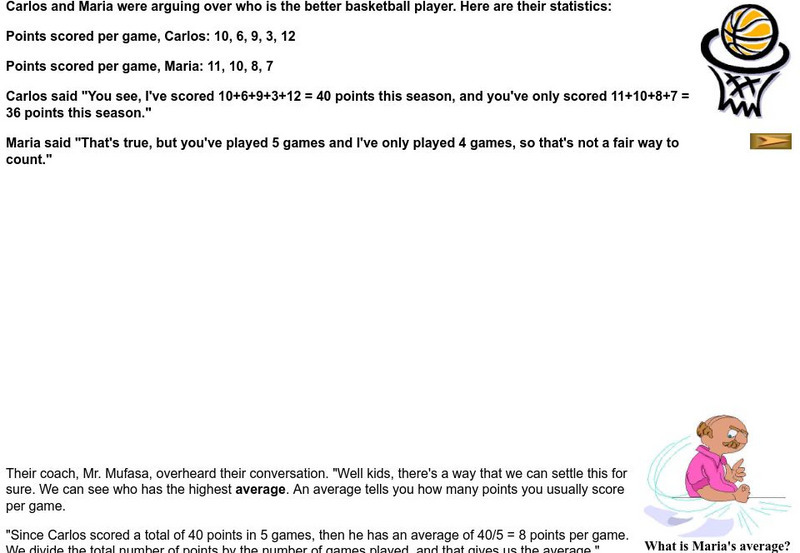
Beacon Learning Center: Basketball Means
Students explore and practice calculating averages in this interactive web lesson.
Alabama Learning Exchange
Alex: "Ridin' Along in My Automobile"
Learners will research prices of used cars to discover how automobiles lose their value over time. Students will create a chart to record their information, use their chart to graph their data, and find measures of central tendency of...
Alabama Learning Exchange
Alex: Estimation Station
During this lesson, students will learn the difference between estimation and guessing. Knowing how to estimate is an essential skill that will help students determine approximate totals as well as check the reasonableness of their...
Alabama Learning Exchange
Alex: The Mean, Median, and Mode Chain Gang
Cooperative learning groups and chain links are used to find the mean, median, and mode. A Science NetLinks activity is linked for further real-life application in the world of baseball (optional). This lesson plan was created as a...
Better Lesson
Better Lesson: What Does the Data Tell Us? Describing Data
Understanding how to interpret data by its shape, spread, and center helps students to understand statistics.
Better Lesson
Better Lesson: Analyze This Part 2!
Srudents connect mean, median, mode and range to real life. It will allow students to make sense of problems by using previously taught strategies.
Better Lesson
Better Lesson: Mean Absolute Deviation. What Does It Mean?
The students will be working with mean and learning about variability. They will be making connections to real life applications to help assist them in making a connection to mean absolute deviation.
Shodor Education Foundation
Shodor Interactivate: Measures
Enter data and view the mean, median, variance, and standard deviation of the data set.
Shodor Education Foundation
Shodor Interactivate: Skew Distribution
Change the median and standard deviation of an automatically generated normal distribution to create a skewed distribution, allowing you to observe properties like what it means for the mean, median, and mode to be different.
Shodor Education Foundation
Shodor Interactivate: Plop It!
PlopIt allows users to build dot plots of data using the mouse. View how the mean, median, and mode change as entries are added to the plot.
CK-12 Foundation
Ck 12: Algebra Ii: 5.5 Sampling Variability
This section explores the concept of sampling variability in the sample proportion. It will address the effect on the mean and standard deviation of a sample distribution as the sampling size changes.
CK-12 Foundation
Ck 12: Algebra Ii: 6.6 the T Test
Learn about a statistical test that is used to compare the means of two groups, the T Test.
CK-12 Foundation
Ck 12: Algebra Ii: 6.5 Confidence Intervals
Explore the idea of a confidence interval where it is easier to predict that an unknown value will lie somewhere within a wide range, than to predict it will occur within a narrow range.
CK-12 Foundation
Ck 12: Algebra Ii: 6.3 Z Scores
See how Z-scores are related to the Empirical Rule from the standpoint of being a method of evaluating how extreme a particular value is in a given set.
CK-12 Foundation
Ck 12: Algebra Ii: 5.8 Evaluating Reports
Learn to analyze examples of claims presented in the media that involve estimating a population proportion and population mean.
Khan Academy
Khan Academy: Center and Spread Lesson
The resource from Khan Academy provides practice questions for the Praxis Core Math Test. This section reviews probability and statistics questions connected to the center and spread of data in a collection.


