Curated OER
How Many Blades of Grass in a Football Field?
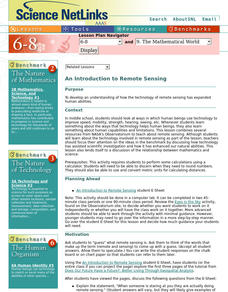
Learners, by taking a sample count from a small area, estimate the total number of blades of grass in a football field. They use a cardboard from, the inside of which measures 1 square foot to do their calculations.
Curated OER
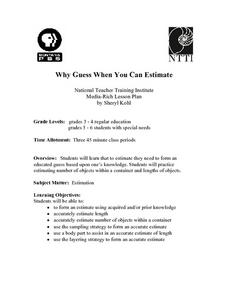
Why Guess When You Can Estimate
They apply various strategies in their estimations. They analyze the differences between guessing and estimating. They estimate the number of beans and jellybeans in egg cartons and jars respectively.
Curated OER
Measured Opinions
Students read "Public Is Wary but Supportive on Rights Curbs," at the New York Times online. They explore how opinion polls are created and conducted, focusing on the wording of questions and the methods of sampling a population.
Curated OER
Bias Sampling
Students explore statistics by conducting a scientific study. In this data analysis lesson plan, students conduct a class poll about popular foods of their classmates. Students complete a worksheet and discuss how bias opinions affect...
Curated OER
Assessing the quality of habitat for Monarch Butterflies
Students use different sampling methods to determine the population size and appropriate space for monarch butterflies. For this averages lesson plan, students complete word problems where they can accurately estimate the size of an...
Curated OER
Making Blood!
Ninth graders study facts about human blood and what it is made of. In this blood composition lesson students divide into groups and complete several activities.
Curated OER
Sampling Rocks
Learners study rocks they find on the playground. In this investigative instructional activity students collect and analyze rocks they find and answer questions about them.
Curated OER
Freshwater Macroinvertebrates
Middle schoolers identify and count Macroinvertebrates at a Hydrology website. In this macroinvertebrates lesson students collect, sort and identify Macroinvertebrates.
Curated OER
Ingetrated Algebra Practice
For this integrated algebra worksheet, students solve probability problems. They identify the appropriate sample space for the given experiment. This two-page worksheet contains 4 multiple-choice problems. Answers are provided on the...
Curated OER
Recognizing Bias in Graphs
In this bias in graphs worksheet, students examine graphs and explain the data. They determine why the graph is or is not biased. This four-page worksheet contains approximately 6 problems. Explanations and examples are provided.
Curated OER
Questionnaires and Analysis
In this questionnaires and analysis worksheet, students design a questionnaire and then select a sample. They organize and analyze data. This four-page worksheet contains 1 multi-step problem. Explanations and examples are provided.
Curated OER
Sampling
For this sampling worksheet, students collect samples concerning the heights of classmates. They determine the mean height for the population. This two-page worksheet contains 4 problems.
Curated OER
Business & Statistics: Final Exam
In this business and statistics worksheet, students read real-life business problems, arrange data, and identify the probability method best used to determine the answer. They identify the type of random sample, draw stem-and-leaf plots,...
Curated OER
Probability
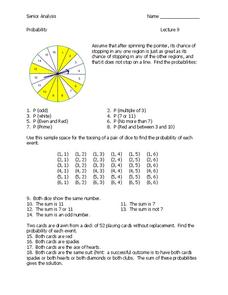
In this probability instructional activity, learners solve and complete 32 different problems that include the probability and outcome of various events. First, they use the sample space for tossing a pair of dice to determine the...
Curated OER
Tree Diagrams
In this tree diagrams worksheet, students solve and complete 10 different problems that include creating tree diagrams. First, they toss a coin and roll a die simultaneously to determine the outcomes with a tree diagram. Then, students...
Curated OER
Normal Curve Areas
In this normal curve areas worksheet, learners follow 6 steps to compute probability regarding possible sample means using a large sample. First, they label the scale with the mean and corresponding standard deviations. Then, students...
Curated OER
Exam 3 Review - Probability
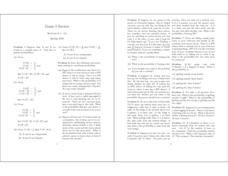
For this probability worksheet, learners find the probability of given problems. They compute both independent and dependent events. This two-page worksheet contains approximately 35 problems.
Curated OER
Copyright, Sampling and Mashing
Students examine copyright laws in regard to sharing, sampling and mashing music. After listening to pieces of music, they create their own music sample by combining musical elements and expression. Students visit a specified website...
Curated OER
Hide and Seek Science
Students examine macro-invertebrates in order to better understand their link to the food web. Working in groups, they record observations of several areas of a stream or river, collect samples from the river bottom, and identify the...
Curated OER
Significant Science: Statistics for Planet Earth
Ninth graders discover how statistics are used to interpret results of scientific experiments. Students write hypotheses and test the hypotheses by collecting data and organizing the data. Students graph their data to produce a visual....
Curated OER
One Square Meter
Students explore the concept of a quadrat study. Students select and investigate a site and conduct a quadrat survey. They take measurements, observe the area and analyze their findings.
Curated OER
Get a Half-life!
Young scholars use m&m candies as their sample set. They begin by counting the total number of candies to determine their sample size. Students put the candies into a cup and shake them gently before pouring them onto a paper plate....
Curated OER
School Made Sampling Field Studies
Students explore the use of sounding lines and secchi disks. They construct
sounding lines to measure the depth of a water body and secchi disks to measure turbidity of water.
Curated OER
Samples and Stats
Students explore different methods of taking surveys and conducting polls and examine these methods for bias. They design and administer a sample survey, analyze the data and present their findings to the class.


