Hi, what do you want to do?
Curated OER
Heating Curve
Wow! This is a nifty presentation for teaching high school chemists about the heating curve. It displays a graph for temperature vs. heat added, then enters the curve itself. The final slide identifies each part of the curve. Notes are...
Curated OER
What on Earth is Matter?
A somewhat strangely formatted slide show that contains multiple examples of matter types. The classification and state explanations given would be useful as practice of substance identification and the heating curve may prove to be...
Curated OER
Ice Cream Lab
I scream, you scream, we all scream for ice cream! Even high schoolers enjoy making ice cream. This laboratory exercise has them record the temperature changes throughout the process of liquid becoming solid, graph the results, and...
Curated OER
Heating Curve Lab
Tenth graders examine the heating curve of water when head is added constantly over time. They input values into a calculator as they record water temperature every thirty seconds as it is heated on a hot plate. They complete the...
Curated OER
Calorimetry Worksheet
In this calorimetry worksheet, students determine the change in enthalpy, sketch the heating curve, and determine the specific heat and heat of fusion for a given compound. This worksheet has 4 problems to solve.
Curated OER
Activity #15 What Happens To A Liquid As Energy Is Added?
Learners model the arrangement of particles in a liquid. They use the model, to demonstrate how a gas is formed from a liquid with no increase in temperature as energy is added. Pupils model the arrangement and movement of gas particles.
Michael Blaber, PhD
Florida Sate University: Changes of State: Heating Curve for Water
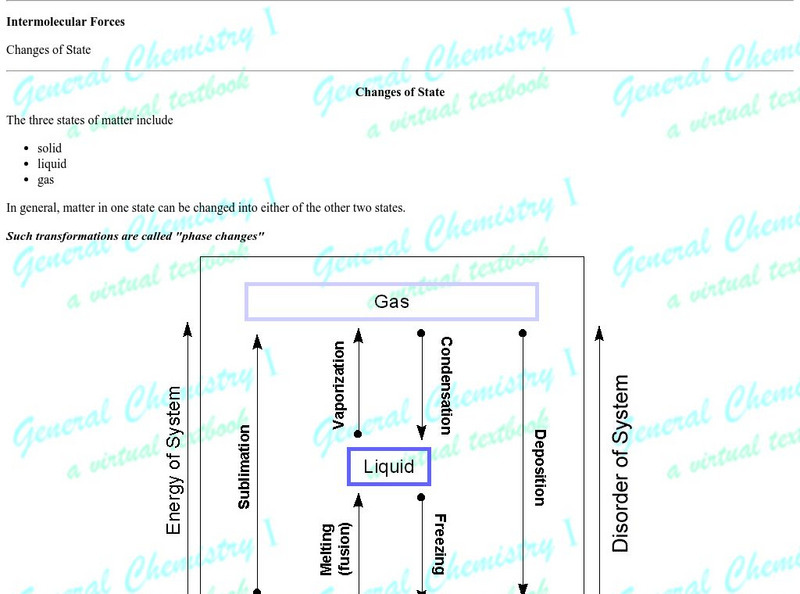
Discusses the phase changes and heating processes of water and how this can be illustrated with a heating curve.
Chem Tutor
Chemtutor: Heating Curve Problems
Nice set of problems dealing with the concept of a heating curve. Students can click on the question and get immediate feedback on their answer.


