Hi, what do you want to do?
Illustrative Mathematics
Illustrative Mathematics: S Id.1,2,3 Speed Trap
A statistically-minded state trooper wondered if the speed distributions are similar for cars traveling northbound and for cars traveling southbound on an isolated stretch of interstate highway. Learners will use the data collected by...
TED Talks
Ted: Ted Ed: David Mc Candless: The Beauty of Data Visualization
Listen and watch as David McCandless turns complex data sets into beautiful, simple diagrams. He suggests that information design is really important because we all like to visualize our information. [18:19]
ABCya
Ab Cya: It's Glow Time Mean, Median, Mode, & Range
Want to have fun while learning Mean, Median, Mode, and Range? Well... It's Glow Time! In this game kids can play a favorite arcade game to earn tickets and points, and then analyze the data. Type in the correct answers to enter Free...
National Council of Teachers of Mathematics
Nctm: Illuminations: Histogram Tool
This tool can be used to create a histogram for analyzing the distribution of a data set using data that you enter or using pre-loaded data that you select.
National Council of Teachers of Mathematics
Nctm: Illuminations: Box Plotter
Use this applet to create a customized box plot with your own data, or display a box plot of an included set of data.
National Council of Teachers of Mathematics
Nctm: Illuminations: Mean and Median
This applet allows the user to investigate the mean, median, and box-and-whisker plot for a set of data that they create.
National Council of Teachers of Mathematics
Nctm: Illuminations: Circle Grapher
Use this tool to graph data sets in a circle graph. You can input your own data or alter a pre-made data set.
National Council of Teachers of Mathematics
Nctm: Illuminations: Bar Grapher
Graph data sets in bar graphs.
Shodor Education Foundation
Shodor Interactivate: Histogram
View histograms for built-in or user-specified data. Experiment with how the size of the class intervals influences the appearance of the histogram.
Shodor Education Foundation
Shodor Interactivate: Regression
Plot a bivariate data set, determine the line of best fit for their data, and then check the accuracy of your line of best fit.
Shodor Education Foundation
Shodor Interactivate: Measures
Enter data and view the mean, median, variance, and standard deviation of the data set.
Khan Academy
Khan Academy: Computing Basic Statistics
Check your understanding of what simple statistics can be computed on a data set, in this set of free practice questions designed for AP Computer Science Principles students.
Cuemath
Cuemath: Average
A comprehensive guide for learning all about averages with definitions, uses, how to calculate it, , solved examples, and practice questions.
Shodor Education Foundation
Shodor Interactivate: Comparison of Univariate and Bivariate Data
Young scholars learn about the difference between univariate and bivariate data and understand how to choose the best graph to display the data.
Quia
Ixl Learning: Dot Plots
Brush up on your math skills relating to dot plots then try some practice problems to test your understanding.
Quia
Ixl Learning: Box and Whisker Plots
Brush up on your math skills relating to box and whisker plots then try some practice problems to test your understanding.
Quia
Ixl Learning: Interquartile Range
Brush up on your math skills relating to interquartile range then try some practice problems to test your understanding.
Quia
Ixl Learning: Line Plots
Brush up on your math skills relating to line plots then try some practice problems to test your understanding.
Quia
Ixl Learning: Frequency Tables
Brush up on your math skills relating to frequency tables then try some practice problems to test your understanding.
Quia
Ixl Learning: Scatter Plots
Brush up on your math skills relating to scatter plots then try some practice problems to test your understanding.
BSCS Science Learning
Bscs: Invitations to Inquiry With Data Using Field Scope
Invitations to Inquiry are short instructional activities designed to help middle and high school students work with large data sets. Teachers and students use the interactive FieldScope platform to collect, visualize, and analyze...
Soft Schools
Soft Schools: Outliers
On this websites students explore the concept of outliers. Students are given several data sets and investigate how outliers can effect the mean and median of a data set.
Rice University
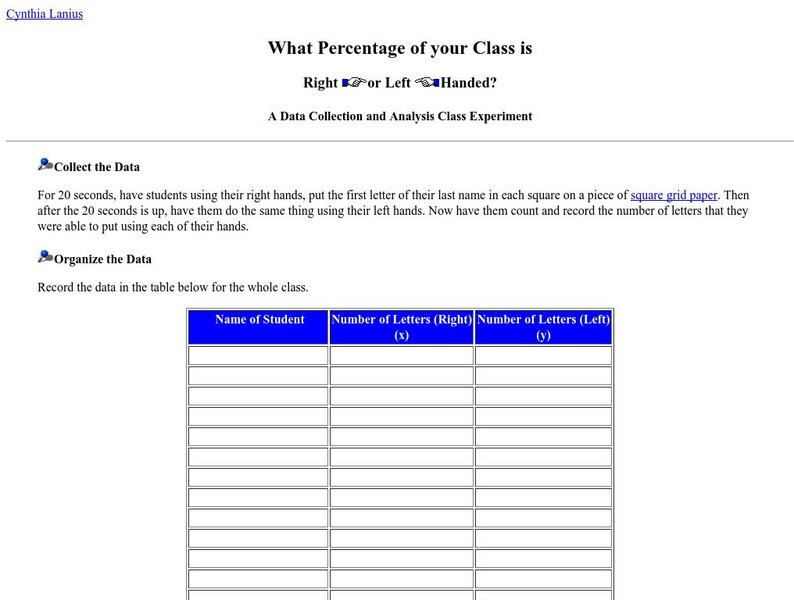
What Percentage of Your Class Is Right or Left Handed?
What percentage of the class is right or left-handed? Students will investigate this question using statistical processes of collecting the data, organizing it, graphing, and finally analyzing it. Follow-up questions are provided for the...
BBC
Bbc: Standard Deviation
A demonstration of how to find the standard deviation of a set of data. Several examples and a practice test are offered.


