Curated OER
It's In The Chocolate Chips
Students investigate which brand of chocolate chip cookies contains the most chocolate. They analyze and compare data using Microsoft Word and Microsoft Excel. They communicate the results with Microsoft PowerPoint.
Curated OER
Grade 1: More Land or Water?
First graders listen as the teacher reads a story involving cross-continent traveling. Students collect a random sample by tossing an inflatable globe and recording whether they touch land or water each time they catch the globe in order...
Curated OER
Creating a Graph
Students brainstorm favorite things to do during the summer. They survey classmates to collect data, arrange it in a chart, and create graphs using ClarisWorks.
Curated OER
Measurement and Data Collecting using Image Processing
Young scholars trace the route of the historical event and measure the distance over which the people involved journeyed. A data sheet be constructed outlining the location of events, and the speed with which the journey occurred.
Curated OER
Great Graphing
Students collect data, use a computer spreadsheet program to create various graphs, and compare the graphs. They state the findings of each graph in writing and decide which graph type best represents the data.
Curated OER
The Internet Pizza Server - Creating Your Own Pizza
Students create their own pizza, "order" it from the Internet, and see digitized versions. They calculate the area of various size pizzas in order to do cost analysis to determine best buys.
Curated OER
Learning in Cockroaches
Students make scientific observations. In this stimulus response lesson, students make observations and collect data to determine if cockroaches can learn. A secondary purpose of this lesson is to provide students with the opportunity to...
Curated OER
Osmosis and the Cell Membrane-part 2
Young scholars participate in a review of diffusion and the basic properties of the cell membrane before exploring the process of osmosis in a lab activity. Using shell-less eggs that have soaked in various solutions, students make...
Curated OER
Compare Sets of Objects Guided Lesson
Practice math vocabulary terms fewer, more, and data using this visual-object-analysis guide. Learners observe three sets of objects and answer three questions, two of which compare numbers of objects, and the last which...
Curated OER
Microsoft Access Lesson Plan
Third graders read children's literature during the school year and compile a list of books and genres in an Access database. They print out a report of all the different books and genres of they read over the whole school year.
Curated OER
The Write Stuff
Fourth graders share a previously written portfolio piece and the class guesses the genre. Students use tally marks to keep track of how many of each piece there are in class. Once the data collection is complete, 4th graders create a...
Curated OER
Kindergarten Class Favorites
Students discuss their favorite foods, a list of four favorite food are compiled on the board or a chart. They each vote for their favorite food and the data is entered onto a spread sheet and a graph is created while the students watch...
Curated OER
Data Collection Graph
To be used however fits your needs most, this data collection graph includes spaces to chart a years worth of data. Print, keep handy, and fill out as the target skill is performed.
Curated OER
Details, Details
Students explore statistics by participating in a personal details activity. In this data collection lesson, students identify the importance of personal information collection and how it can be used against them if collected illegally....
Curated OER
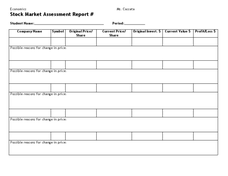
Stock Market Assessment Report
In this stock market assessment report worksheet, learners track the progress of share prices in the stock market using the provided graphic organizer.
Curated OER
Designing a Speedometer
In this algebra worksheet, students analyze the designs of a speedometer. They collect data on the distance and time as the speedometer works. They draw conclusion and make predictions from the collected data. There are 4 word problems.
Curated OER
Maglev Train
In this statistics worksheet, students collect data on train time using speed and time. They differentiate between the upper and lower bound of their data. There are 7 questions on 2 pages.
Curated OER
Visual Communication of Quantative Data
Students collect and analyze data based on academic performance. In this statistics lesson, students create graphs and analyze the data they created. They use positive, negative and no correlation to analyze the data.
Curated OER
Hand Sensitivity
Students experiment with the sense of touch. In this tactile lesson plan, students determine the most sensitive area of the hand. Students experiment by describing objects through touch only. Students compare the amount of sensory data...
Curated OER
Plotting Data on a Graph
Students investigate graphing. In this graphing lesson, students survey the class and create graphs to reflect the data collected.
Curated OER
Interpreting Graphs
Students investigate graphs. In this graphing lesson, students create a graph regarding the population of California. Students extrapolate answers concerning the data set.
Curated OER
Seed Germination
Students explore plants and the scientific method. In this plant growth lesson, students follow the steps in the scientific method to perform a seed germination experiment as a whole class. Students work in a group to create their own...
Curated OER
Let's Get Physical
Learners collect data using the CBL. In this statistics instructional activity, students predict the type of graph that will be created based on the type of activity the person does. The graph represents heart rate depending the level of...
Curated OER
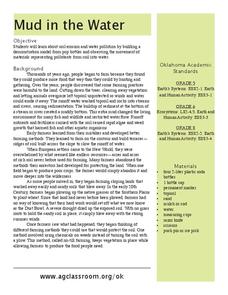
Mud in the Water
Sixth graders investigate erosion. For this erosion lesson, 6th graders explore how farming changes the environment. Students construct an erosion model and research ways to protect the soil from excess mud generated by farming.


