Curated OER
A Wet Welcome Home
Students investigate data collection and analysis. In this Algebra I activity, students create a scatter plot and find the equation of best fit in a simulation of a leaking water pipe.
Curated OER
A Tall Story
Students investigate the growth rate of a man named Bob Wadlow. In this growth rate of a man lesson, students determine if the growth rate of this particular man was normal or abnormal. Students bring in data of their height...
Curated OER
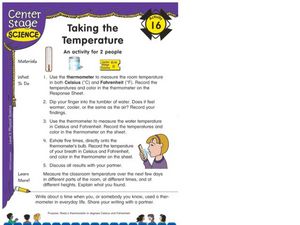
Taking the Temperature
Students read a thermometer in Celsius and Fahrenheit. In this thermometer reading lesson, students take the temperature in different situations and discuss the results with a partner.
Texas Instruments
Light and Day
Pupils explore the concept of collecting data as they collect data on their graphing calculator about time, temperature, and light. Learners plot the data and create histograms and box and whisker plots to analyze the data.
Curated OER
Sorting Sweethearts
Learners categorize sweetheart candy by color or message. In this sorting and graphing lesson, students collect data by sorting the candy and then diagram their results in a graph.
Curated OER
What Are Erosion and Sediments?
Middle schoolers create experiments in class based on the erosion of Earth. In this erosion lesson, students perform a lab in class replicating the effects of erosion. Middle schoolers finally draw their own conclusions based on the...
Curated OER
Observing Properties of Matter
Third graders explore matter. In this physical science lesson, 3rd graders observe several items and use their five senses to describe their properties. Students record their observations and share with the class.
Alabama Learning Exchange
Poppin' For Popcorn!
Students graph data from different popcorn flavors. For this graphing lesson, students make graphs using an assigned web site after collecting data about the flavors of popcorn that fellow classmates prefer.
Alabama Learning Exchange
Keep It Movin'!
Learners conduct an experiment to study friction. They complete a KWL chart on friction and conduct an activity about the amount of friction on a moving object. To conclude, pupils create a table or graph of the data collected and they...
Curated OER
Data! Data! Graph that Data!
Fifth graders create data graphs using Microsoft Excel. For this data collection lesson, 5th graders create and conduct a survey, then use Excel to organize and graph their data.
Curated OER
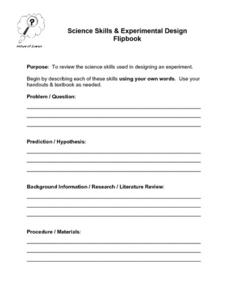
Science Skills and Experimental Design
In this experimental design worksheet, students describe the different science skills required when designing an experiment. Then students create a flipbook with the information. This worksheet has 9 short answer questions.
Curated OER
A Taste of Our Classroom
Students explore their classroom tastes. In this lesson plan, students list the four tastes that the tongue can detect, map the individual areas of taste on the tongue, and demonstrate the ability to identify objects through the use of...
Curated OER
Gummy Bear Math
First graders predict, collect data, and create a graph based on gummy bear colors they are given. For this graphing lesson plan, 1st graders first predict how many colors of gummy bears there are. They then count the colors, graph them,...
Curated OER
TV Survey - Data Collection and Analysis
In this data collection and analysis learning exercise, 4th graders complete a tally chart about the number of hours that fourth graders watch television. They create a bar graph with the information, write a paragraph about the survey...
Curated OER
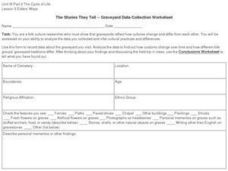
The Stories They Tell -- Graveyard Data Collection Worksheet
In this folk culture research worksheet, students use the form to record data about a graveyard that they visit to show that graveyards reflect how cultures change and differ from each other.
Curated OER
Animal Runners
In this collecting data instructional activity, 4th graders use the data shown on how fast 6 animals can run to create a bar graph. Students follow the instructions on 3 directives for their bar graphs and answer 1 short answer question.
Curated OER
Cricket Weather
In this collecting data worksheet, 4th graders use the data collected on crickets chirps and the temperature to make a line graph by following 4 directives.
Curated OER
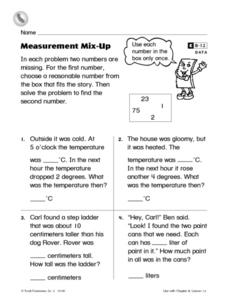
Measurement Mix-Up
In this measurement worksheet, 2nd graders read 4 word problems and find the two numbers missing in each one. Students choose a reasonable number from the box that fits the story for the first number and then solve the problem to find...
Curated OER
Frequency Tables; Discrete Ungrouped Data
In this frequency tables worksheet, students utilize given data to work out three frequency charts with one containing values and a pie chart involving angles for each value. Students complete three vertical line diagrams and check all...
Curated OER
What Is Technology, and How Does It Benefit Us?
Students examine and define what technology is as well as the differences between science and technology. They assess the role of science and technology in society, conveniences technology offers and create a chart to compare the...
Curated OER
Learning to Interview
Second graders watch simulated interview between the teacher and a student before they interview a classmate using the form provided. Next, they complete two interviews of family members at home. They focus on the concepts of ancestors...
Curated OER
Get Your Numbers in Shape - TI-83
High Schoolers use the TI-83 calculator to produce a sequence, explore patterns and find a linear or quadratic equation for a given pattern. They use inductive reasoning to make conjectures about patterns. They find the Y-value of a...
Curated OER
How Much Water Is Available In The Atmosphere For Precipitation?
Students explore the relationship between the available water in the atmosphere and how it is portrayed on satellites. After examining global moisture and precipitation students research precipitation data graph the results. Using their...
Curated OER
Gathering Data to Problem Solve
Learners, while using reading and writing strategies (subheads, prediction, skim, details, drawing inferences, etc,), solve math problems that involve gathering and representing data (addition, subtraction, multiplication). They practice...


