Willow Tree
Circle Graphs
Pie isn't just for eating! Scholars learn to create pie charts and circle graphs to represent data. Given raw data, learners determine the percent of the whole for each category and then figure out the degree of the circle that percent...
Stats Monkey
Everything I Ever Needed to Learn about AP Statistics I Learned from a Bag of M and M's®
Candy is always a good motivator! Use this collection of M&M's® experiments to introduce statistics topics, including mean, standard deviation, nonlinear transformation, and many more. The use of a hands-on model with...
National Research Center for Career and Technical Education
Business Management and Administration: Compound Interest - A Millionaire's Best Friend
Many math concepts are covered through this resource: percentages, decimals, ratios, exponential functions, graphing, rounding, order of operations, estimation, and solving equations. Colorful worksheets and a link to a Google search for...
National Research Center for Career and Technical Education
Architecture and Construction: Stair Construction
Within the context of the construction industry, algebra pros begin to calculate slope from the sizes of stair steps. This is a terrific activity, especially for aspiring engineers. Just be aware that it might be a stretch to meet all of...
National Research Center for Career and Technical Education
Hospitality and Tourism 1: Safety and Sanitation
Math and science come alive in this career-related lesson on sanitation. Along the way, learners explore bacterial growth rates using exponential notation and graphs. A link to a very brief, but vivid video shows just how quickly these...
Curated OER
Interpreting Statistics: A Case of Muddying the Waters
Is river pollution affecting the number of visitors to Riverside Center, and is the factory built upstream the cause of the pollution? Let your class be the judge, literally, as they weigh the statistical evidence offered by the factory...
Illustrative Mathematics
Musical Preferences
If you like rap music, are you more likely to like rock music? Use statistical analysis to determine if there is a positive association between rap and rock in this particular sample. While the problem is relatively simple, the...
Google
Surveys and Estimating Large Quantities
Looking for an estimation activity a bit more involved than the typical "guess the number of jellybeans in the jar" game? Here, learners use a picture to estimate the number of people at a large event, look for potential problems with...
Google
The Law of Large Numbers and Probability
Learners investigate why theoretical probability doesn't always match reality. The activity involves using Python 2.7 (or Sage) to set up a Bernoulli Trial. It also involves setting up a spreadsheet to simulate the Birthday Paradox....
National Research Center for Career and Technical Education
Health Science: Back to Basics
This lesson focuses on unit conversion, proportions, ratios, exponents, and the metric system. Discuss measurement with your math class and demonstrate how to solve several health-science word problems. Give learners a chance to visit an...
Illustrative Mathematics
Why Randomize?
Your statisticians draw several samplings from the same data set, some randomized and some not, and consider the distribution of the sample means of the two different types of samplings. The exercise demonstrates that non-random samples...
Curated OER
School Advisory Panel
How would you choose three high schoolers from your class to be on a school panel that would represent a fair and representative view of opinions? This brief activity offers four different sampling methods to choose from and asks...
Other
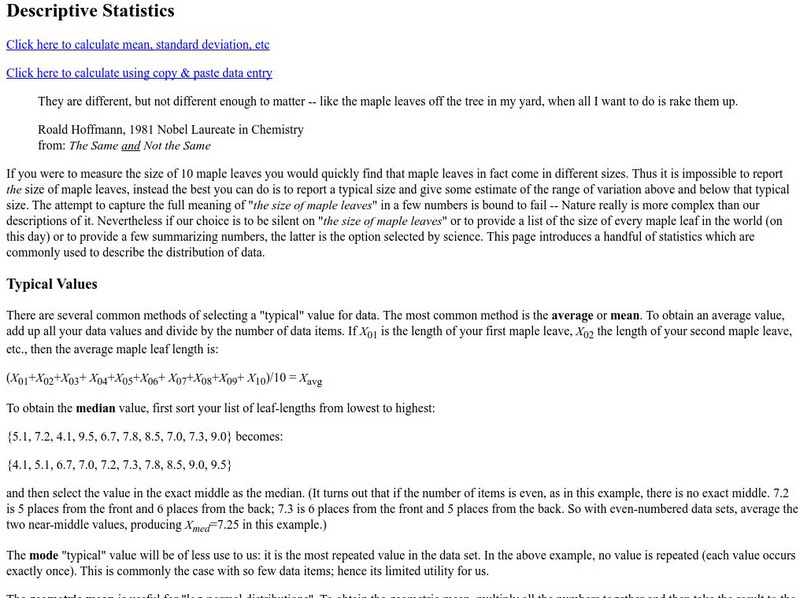
Descriptive Statistics
Very complete explanation of mean, standard deviation, etc. including an online calcluator for these statistics.
Missouri State University
Missouri State University: Introductory Statistics: The Sampling Distribution
A review is provided at the start of this resource, then the more specific discussion of sampling distributions gets under way. Graphs are provided for ease in understanding the material.
Science Education Resource Center at Carleton College
Serc: Seeing and Describing the Predictable Pattern: The Central Limit Theorem
A learning activity where students are guided into discovering the Central Limit Theorem. As they explore sampling distributions, they will identify predictable patterns which can be described with this mathematical theorem. Handouts for...
Science Education Resource Center at Carleton College
Serc: Reese's Pieces Activity: Sampling From a Population
Students use Reese's Pieces to investigate the proportion of orange candies present in a set of 25. After collecting data for the class, they use a web applet to collect more data for random samples. This is compared to the actual...
Vision Learning
Visionlearning: Statistics: Introduction to Inferential Statistics
An introduction to inferential statistics to find relationships and patterns in datasets.
Other
American Statistical Association: Using Dice to Introduce Sampling Distributions
In this lesson, young scholars use a dice simulation to investigate how random sampling affects the properties of the distribution of a sample proportion, and are introduced to the sampling distribution of the sample proportion.
Texas Education Agency
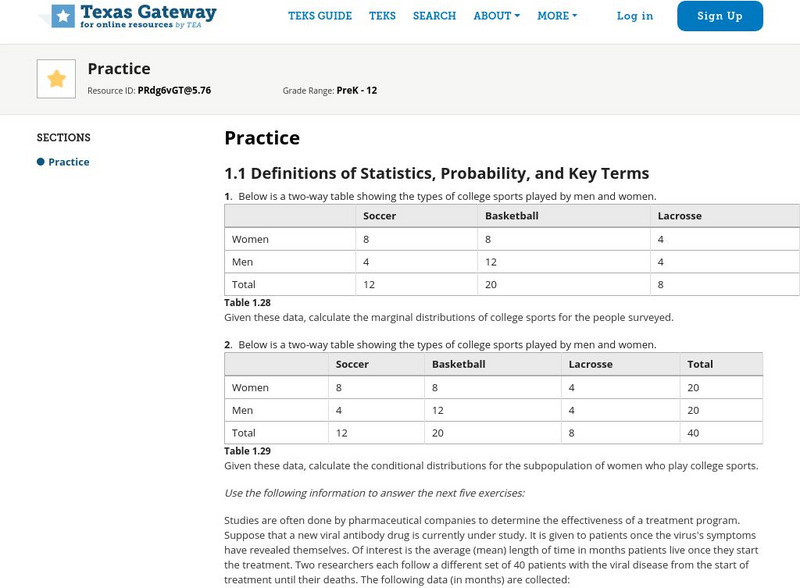
Texas Gateway: Tea Statistics: Sampling and Data: Practice
A set of exercises where students must analyze statistcal data and methodology and answer questions about distributions, sampling, results, accuracy, frequency, experimental design, and ethical practices.
Texas Education Agency
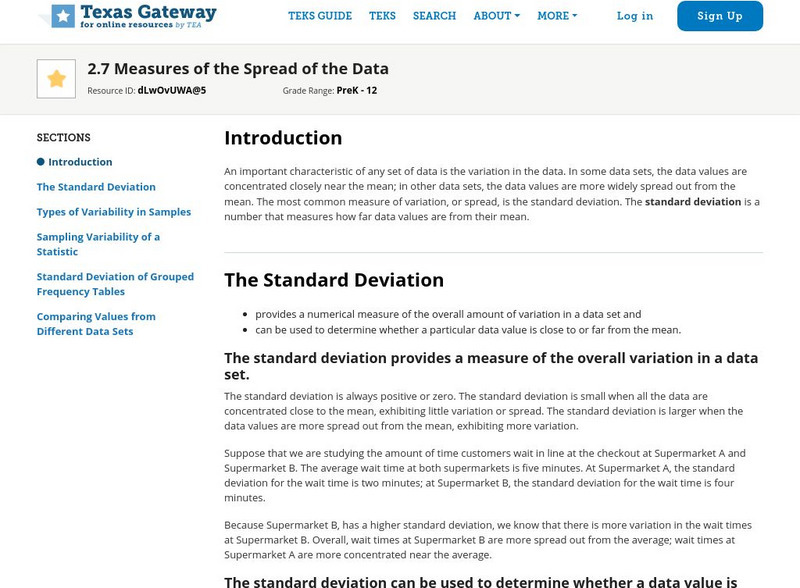
Texas Gateway: Tea Statistics: Measures of the Spread of the Data
This resource explains the different measures of center, variability, etc. that are used to describe the spread of statistical data. Includes examples and practice exercises.
Vision Learning
Visionlearning: Statistics: Using Mean, Median, and Standard Deviation
An introduction to recognizing trends and relationships in data through descriptive statistics.
Texas Education Agency
Texas Gateway: Tea Statistics: Confidence Intervals: Practice
A large collection of practice problems on confidence intervals.
Missouri State University
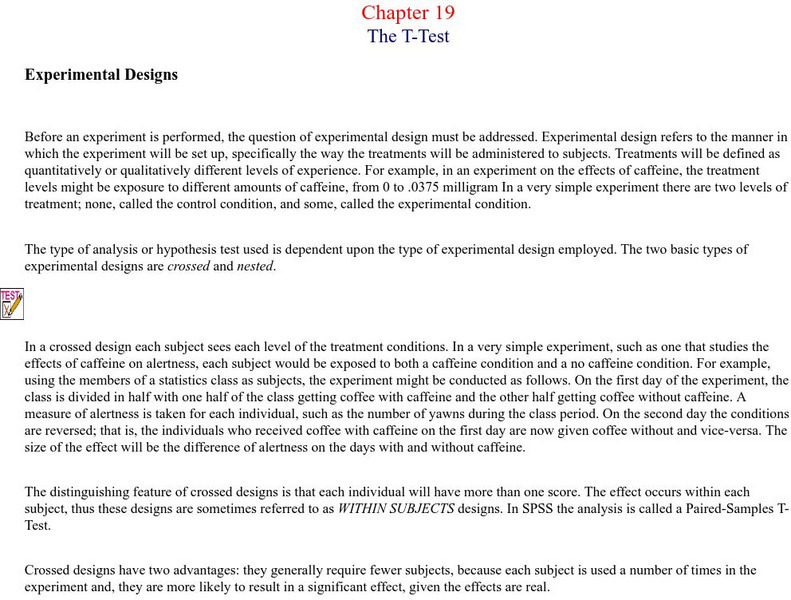
Missouri State University: Introductory Statistics: T Test: The T Distribution
This discussion of statistical t distributions is presented in notes with examples added as needed.
Missouri State University
Missouri State University: Introductory Statistics: Models of Distributions
The different types of distributions are discussed here - uniform, regular, negative exponential, triangular, and normal. The properties of probability distributions are also explained here in detail. A good starting point in the topic...


