Hi, what do you want to do?
Texas Instruments
Texas Instruments: Bacterial Growth and Regression
This activity gives students a set of data to perform a regression analysis. Students need to be able to read the data, perform a regression, and interpolate and extrapolate information.
Texas Instruments
Texas Instruments: Inference for Correlation and Regression
In this activity, students test if a significant relationship exists between a bivariate data set, and then calculate the confidence and predictive intervals. They also improve the interval-prediction capabilities by automating the process.
Texas Instruments
Texas Instruments: Scatterplots and Correlation With Ti 89
Students input data relating the values of one variable associated with values of another and use these data to generate a scatterplot. From the scatterplot, they determine whether there is a correlation between the two variables and...
Ministry of Education and Universities of the Region of Murcia (Spain)
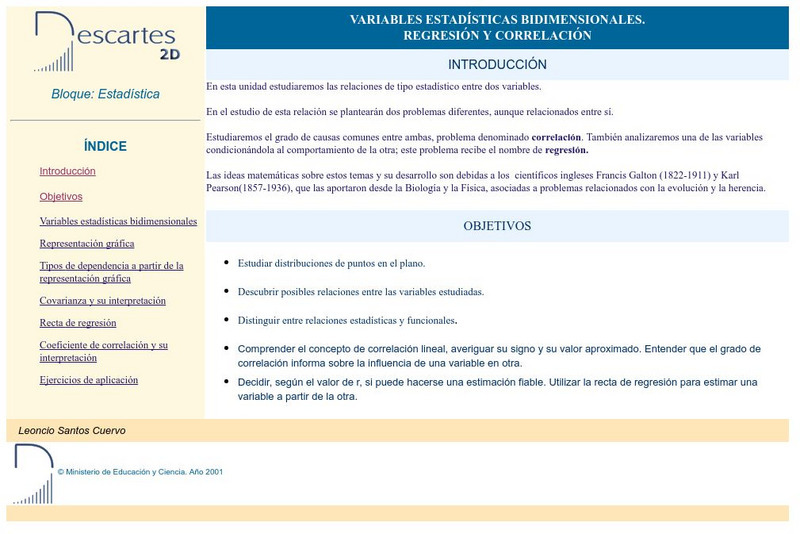
Ministerio De Educacion Y Ciencia: Variable Estadisticas Bidimensionales
In Spanish. This interactive unit shows you the statistical relationship between two variables.
Other
Clayton State: Linear Regression
Introductory look at linear regression. Notes presented in outline form, with key concepts and formulas given. An example is presented at the end.
National Council of Teachers of Mathematics
Nctm: Illuminations: Linear Regression 1
An interactive program where students will explore regression lines. Students will be introduced to the correlation coefficient and come to understand what it represents through the given exploration. Requires Java.
CK-12 Foundation
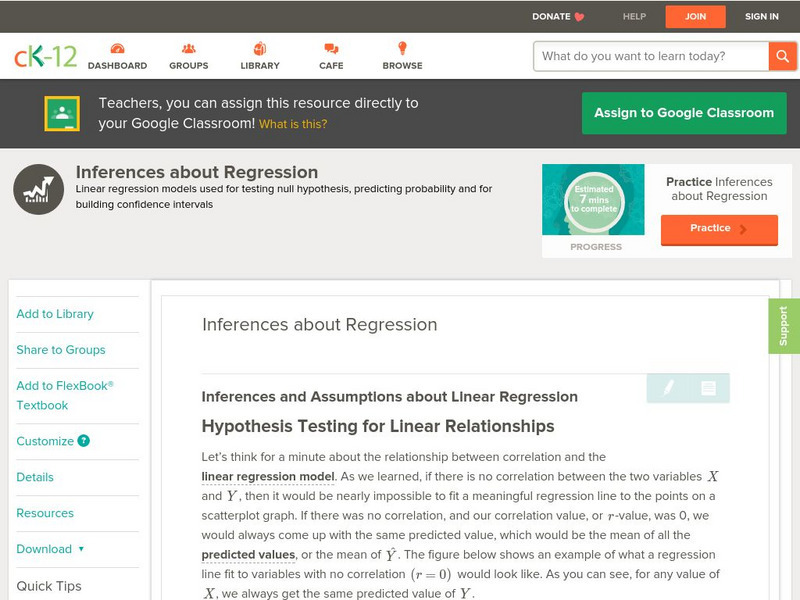
Ck 12: Statistics: Inferences About Regression
[Free Registration/Login may be required to access all resource tools.] This Concept introduces students to testing a claim about linear regression.
NC State University
Nc State University: Multiple Regression
Excellent, comprehensive site on multiple regression. Key terms are defined and explained as needed. Links to relevant topics are provided.
Other
Sky Mark: Scatter Plots
This page gives a description of scatter plots along with examples. Also provides explanations and statistics to aid student understanding.
Annenberg Foundation
Annenberg Learner: Against All Odds: Describing Relationships
Video program showing how to use a scatter plot to illustrate relationship between response and explanatory variables, to determine patterns in variables, and to calculate least squares. Real-life examples -- manatee deaths per number of...
Sophia Learning
Sophia: Linear Correlation Tutorial
Use examples to determine and explain the linear correlation of independent and dependent variables.
University of Regina (Canada)
University of Regina: Math Central: Scatter Plots
Three different concepts are examined about scatter plots. Topics featured are collecting data, analyzing scatter plots, and determining a line of "best fit". The lesson has an overview, material, procedures, and evaluation techniques.
Texas Instruments
Texas Instruments: Correlation Coefficient Lab
Students will learn the meaning of the correlation coefficient, find the regression equation and use it to make predictions.
Texas Instruments
Texas Instruments: Identifying Types of Correlation From a Graph and Calculator
Students will identify different types of correlations graphically and by using the linear regression analysis obtained from a TI-84 Plus calculator. Students will also obtain and know the significance of a correlation coefficient as a...
Texas Instruments
Texas Instruments: Using Regression Functions
In this activity, students experiment with regression features of the calculator to find a best fit for a data set.
Wolfram Research
Wolfram Math World: Correlation Coefficient
This is an elaborate site pertaining to the Correlation coefficient. The site begins with a brief introduction to what the correlation coefficient represents then goes into detail on how to find this value. The site has many links and...
Rice University
Hyper Stat Online Statistics Textbook: Chapter 3: Describing Bivariate Data
This chapter of an online textbook begins with a description of scatterplots, then focuses on the Pearson Product Moment Correlation.
Wolfram Research
Wolfram Math World: Correlation Coefficient
MathWorld offers a technical, yet informative, explanation of the correlation coefficient for bivariate normal distribution.
Texas Instruments
Texas Instruments: Bivariate Data
This set contains statistics questions regarding bivariate data: scatter plots, the least-squares regression line, and their interpretation. The student is asked about the meaning of the various strengths and directions of linear...
Texas Instruments
Texas Instruments: Fitting an Equation to Bivariate Data
In this activity, students fit a linear least-square regression line to population data. They explore various functions to model the given data.
Texas Instruments
Texas Instruments: Exploring Bivariate Data
Students graph scatter plots and understand the concepts of correlation and least-squares regression. They also perform transformations to achieve linearity in the data plot.
Texas Instruments
Texas Instruments: Describing Bivariate Data (Two Quantitative Variables)
Students explore the relationship between two quantitative variables in bivariate data using various x-y plots. They compare the relationships for several categories on the same plot. Students calculate the correlation coefficient to...
Texas Instruments
Texas Instruments: Inferences of the Least Squares Regression
This set contains questions regarding inference for the slope of the least-squares linear regression line. The student learns to develop hypotheses, find the test statistic, and reach a conclusion in the context of the original problem.
Khan Academy
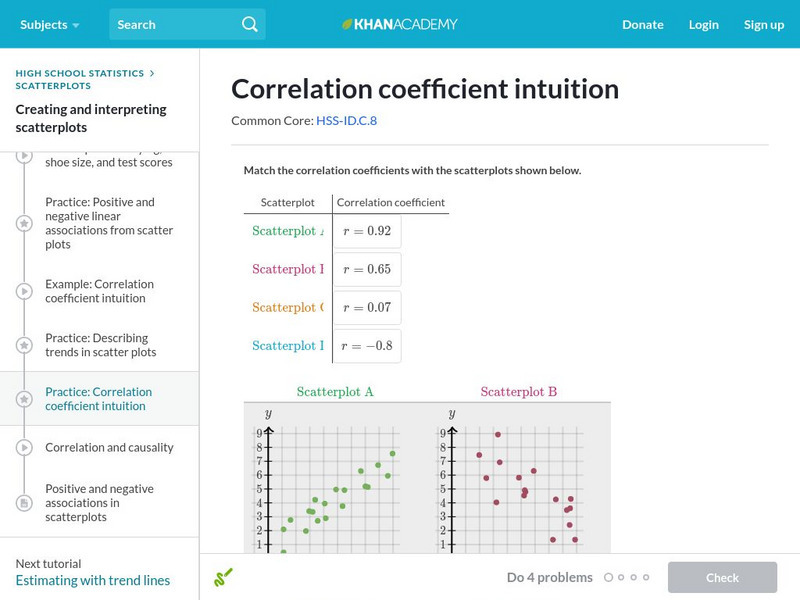
Khan Academy: Correlation Coefficient Intuition
Match correlation coefficients to scatterplots to build a deeper intuition behind correlation coefficients. Students receive immediate feedback and have the opportunity to try questions repeatedly, watch a video or receive hints.


