Math Graphs
Houghton Mifflin: Math Graphs: Line of Best Fit 2 [Pdf]
The practice problem examines the line of best fit and scatter plots. The scatter plot is available in PDF format.
Math Graphs
Houghton Mifflin: Math Graphs: Line of Best Fit 5 [Pdf]
Learners use a scatter plot to determine the line of best fit. The scatter plot is available in PDF format.
Math Graphs
Houghton Mifflin: Math Graphs: Line of Best Fit 6 [Pdf]
Learners use a scatter plot to determine the line of best fit. The scatter plot is available in PDF format.
Math Graphs
Houghton Mifflin: Math Graphs: Line of Best Fit 7 [Pdf]
The practice problem examines the line of best fit and a scatter plot. The scatter plot is available in PDF format.
Math Graphs
Houghton Mifflin: Math Graphs: Line of Best Fit 8 [Pdf]
The practice problem examines the line of best fit and a scatter plot. The scatter plot is available in PDF format.
Math Graphs
Houghton Mifflin: Math Graphs: Line of Best Fit 9 [Pdf]
The practice problem has learners sketch a line of best fit, create a linear model, and compare both lines on a calculator. The given points are available in PDF format.
Math Graphs
Houghton Mifflin: Math Graphs: Line of Best Fit 10 [Pdf]
The practice problem has learners sketch a line of best fit, create a linear model, and compare both lines on a calculator. The given points are available in PDF format.
Math Graphs
Houghton Mifflin: Math Graphs: Line of Best Fit 11 [Pdf]
Students sketch a line of best fit, create a linear model, and compare both lines on a calculator. The given points are available in PDF format.
Math Graphs
Houghton Mifflin: Math Graphs: Line of Best Fit 12 [Pdf]
Students sketch a line of best fit, create a linear model, and compare both lines on a calculator. The given points are available in PDF format.
Math Graphs
Houghton Mifflin: Math Graphs: Line of Best Fit 13 [Pdf]
Students investigate the line of best fit and the regression feature of a graphing calculator. The example consists of a math graph with given points that are available in PDF format.
Math Graphs
Houghton Mifflin: Math Graphs: Line of Best Fit 14 [Pdf]
Students investigate the line of best fit and the regression feature of a graphing calculator. The example consists of a math graph with given points that are available in PDF format.
Math Graphs
Houghton Mifflin: Math Graphs: Line of Best Fit 15 [Pdf]
The practice problem explores the validity of the line of best fit and a linear regression model created on a graphing calculator. The given points are available in PDF format.
Math Graphs
Houghton Mifflin: Math Graphs: Line of Best Fit 16 [Pdf]
The practice problem explores the validity of the line of best fit and a linear regression model created on a graphing calculator. The given points are available in PDF format.
Math Graphs
Houghton Mifflin: Math Graphs: Line of Best Fit 17 [Pdf]
Students calculate a linear regression model using a graphing calculator. The given points are available in PDF format.
Math Graphs
Houghton Mifflin: Math Graphs: Line of Best Fit 18 [Pdf]
Students calculate a linear regression model using a graphing calculator. The given points are available in PDF format.
Math Graphs
Houghton Mifflin: Math Graphs: Line of Best Fit 19 [Pdf]
The exercise has learners create the line of best fit for the given points. The handout is available in PDF format.
Math Graphs
Houghton Mifflin: Math Graphs: Line of Best Fit 20 [Pdf]
The exercise has learners create the line of best fit for the given points. The handout is available in PDF format.
Other
Correlation Coefficients
This page provides a good discussion of correlation coefficients (r,) which indicate the "strength of the linear association between variables." Includes formulas and scatter plots. Some prior knowledge of statistics might be helpful.
ClassFlow
Class Flow: Scatter Graphs Handling Data
[Free Registration/Login Required] In this flipchart, students analyze a pattern, in the form of a scatter graph then judge the reasonableness of conclusions drawn from a set of data.
National Council of Teachers of Mathematics
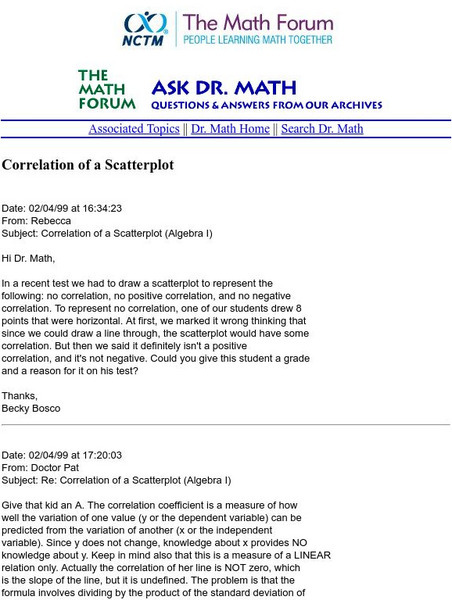
The Math Forum: Nctm: Ask Dr. Math: Correlation of a Scatterplot
This page from Ask Dr. Math describes the correlation of a scatterplot and gives an example of one with no correlation.
University of Glasgow
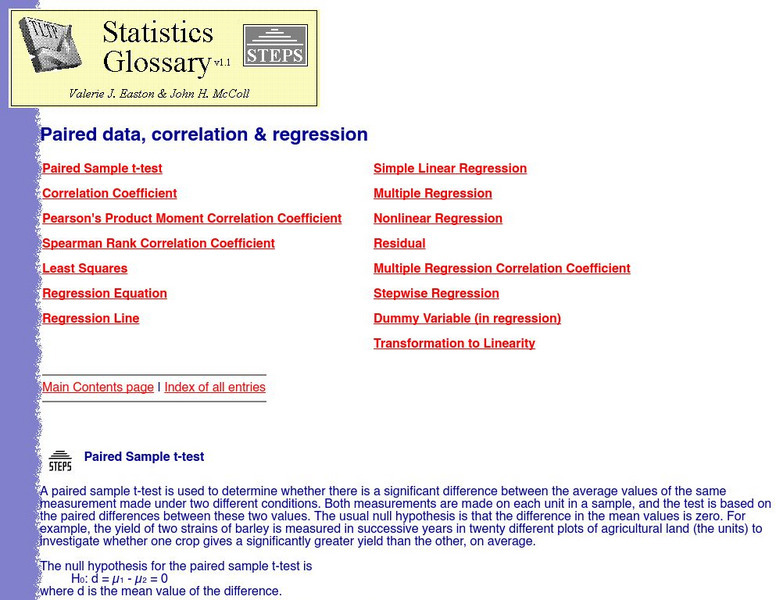
University of Glasgow: Steps Statistics Glossary: Correlation Coefficient
Overview of correlation coefficient, or a number between 1 and -1 which measures the degree to which two variables are linearly related. It is followed by a description of the Pearson product moment correlation coefficient.
Wolfram Research
Wolfram Math World: Linear Regression Model
A basic definition for what linear regression is can be found here. Examples of forms of linear regression are also given.
![Houghton Mifflin: Math Graphs: Line of Best Fit 2 [Pdf] Unknown Type Houghton Mifflin: Math Graphs: Line of Best Fit 2 [Pdf] Unknown Type](https://static.lp.lexp.cloud/images/attachment_defaults/resource/large/FPO-knovation.png)


