University of Hawai'i
University of Hawaii: Understanding Correlation
This page gives a lot of information on correlation, including a section on the coefficient of correlation.
Other
Stat Soft: Multiple Regression
This resource has a lot of information on multiple regression. It also contains information on the regression line.
Varsity Tutors
Varsity Tutors: Hotmath: Practice Problems: Correlation and Lines of Best Fit
Twenty problems present a variety of practice determining correlation based on data in a scatter plot and using lines of best fit with given data. They are given with each step to the solution cleverly revealed one at a time. You can...
National Institute of Standards and Technology (NIST)
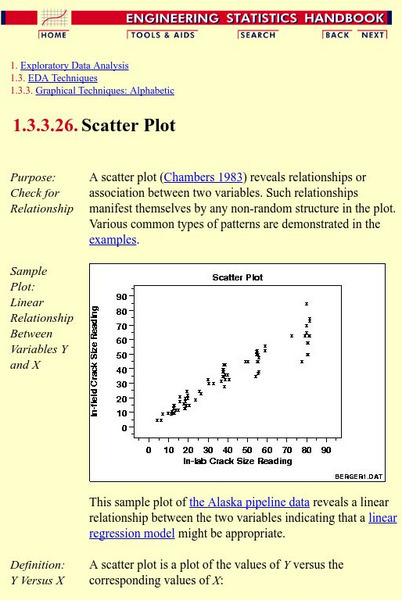
Nist: Engineering Statistics Handbook: Scatter Plots and Linear Regression
An explanation of scatter plots followed by examples of the many different kinds of scatter plots.
Science Education Resource Center at Carleton College
Serc: The Evolution of Pearson's Correlation Coefficient
For this activity, students explore nine scatter plots to develop their understanding of how two quantitative variables are related. Through an exploration of the properties of this association, they come to understand the standard...
University of Colorado
University of Colorado: Ph Et Interactive Simulations: Least Squares Regression
Create your own scatter plot or use real-world data and try to fit a line to it. Explore how individual data points affect the correlation coefficient and best-fit line.
Oswego City School District
Regents Exam Prep Center: Regression Analysis
A collection of lesson ideas, a practice activity, and teacher resources for exploring regression analysis.
Texas Education Agency
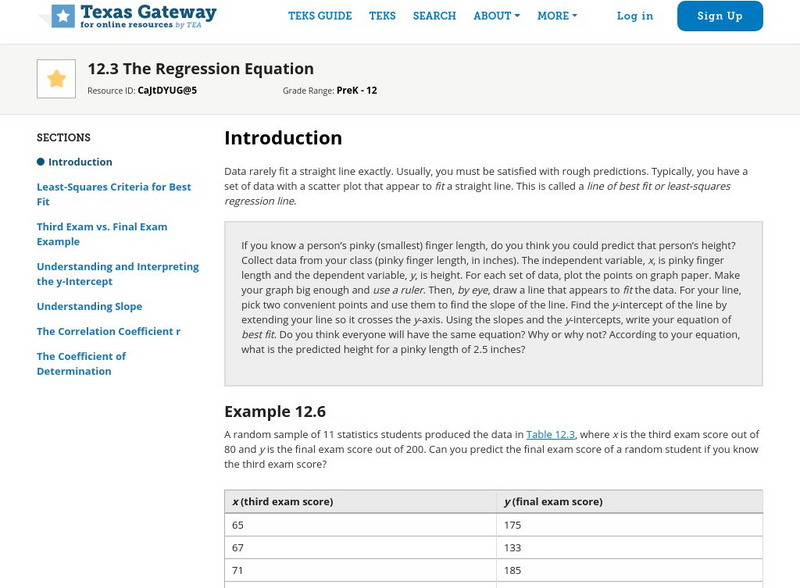
Texas Gateway: Tea Statistics: The Regression Equation
A tutorial on how to find the line of best fit or least-squares regression line for a set of data in a scatter plot using different methods and calculations.
Texas Education Agency
Texas Gateway: Collecting Data and Making Predictions
Given an experimental situation, the student will write linear functions that provide a reasonable fit to data to estimate the solutions and make predictions.
Duke University
Duke University: Introduction to Linear Regression
This page discusses linear regression, its equations, background, and applications. Provides questions, answers, formulas, and explanations for understanding.
National Council of Teachers of Mathematics
The Math Forum: Ask Dr. Math: Regression Method
This page goes over what regression method is and how a regression line fits in. Dr. MAth also suggests a book on regression if you are interested.
Texas Instruments
Texas Instruments: Investigate Outliers Effect on Regression Lines
In this activity, students begin to investigate linear regression by looking at the effect of outliers on the regression line. The worksheet is interactive.
Texas Instruments
Texas Instruments: What Is Linear Regression?
In this activity, students will explore finding the line of best fit based on the sum of the squares of the residuals and determine what the linear regression line is.
Texas Instruments
Texas Instruments: Line of Best Fit
In these questions, students will find the linear equation of best fit for a set of data and interpret the correlation coefficient. Questions are multiple-choice and true/false; solutions are provided.
Texas Instruments
Texas Instruments: Work vs. Leisure
Students can use lists of data and the correlation factor of various regressions to determine the best regression line.
Texas Instruments
Texas Instruments: Run Me a Linear Regression
This activity is designed to give students the opportunity to estimate the least squares line given a set of points. The students are then able to check their "best fit" line by running a linear regression using the graphing calculator.
Texas Instruments
Texas Instruments: Bacterial Growth and Regression
This activity gives students a set of data to perform a regression analysis. Students need to be able to read the data, perform a regression, and interpolate and extrapolate information.
Texas Instruments
Texas Instruments: An Exploration of Direct Variation and Linear Regression
Students will use this activity for the following Algebra concepts: Review of Direct Variation; Properties of direct variations; Finding the constant of variations from data sets; Find missing values in data sets both numerically and...
Texas Instruments
Texas Instruments: Scatterplots and Correlation With Ti 89
Students input data relating the values of one variable associated with values of another and use these data to generate a scatterplot. From the scatterplot, they determine whether there is a correlation between the two variables and...
Ministry of Education and Universities of the Region of Murcia (Spain)
Ministerio De Educacion Y Ciencia: Variable Estadisticas Bidimensionales
In Spanish. This interactive unit shows you the statistical relationship between two variables.
Other
Clayton State: Linear Regression
Introductory look at linear regression. Notes presented in outline form, with key concepts and formulas given. An example is presented at the end.
National Council of Teachers of Mathematics
Nctm: Illuminations: Linear Regression 1
An interactive program where students will explore regression lines. Students will be introduced to the correlation coefficient and come to understand what it represents through the given exploration. Requires Java.
NC State University
Nc State University: Multiple Regression
Excellent, comprehensive site on multiple regression. Key terms are defined and explained as needed. Links to relevant topics are provided.
Texas Instruments
Texas Instruments: Correlation Coefficient Lab
Students will learn the meaning of the correlation coefficient, find the regression equation and use it to make predictions.
