Hi, what do you want to do?
University of Colorado
University of Colorado: Normal Probabilities Applet #3
The Applet illustrates how to use the old-fashioned tables of normal probabilities and areas under the normal distribution cureve to arrive at corresponding graphs of the areas. A good resource for the topic.
Texas Instruments
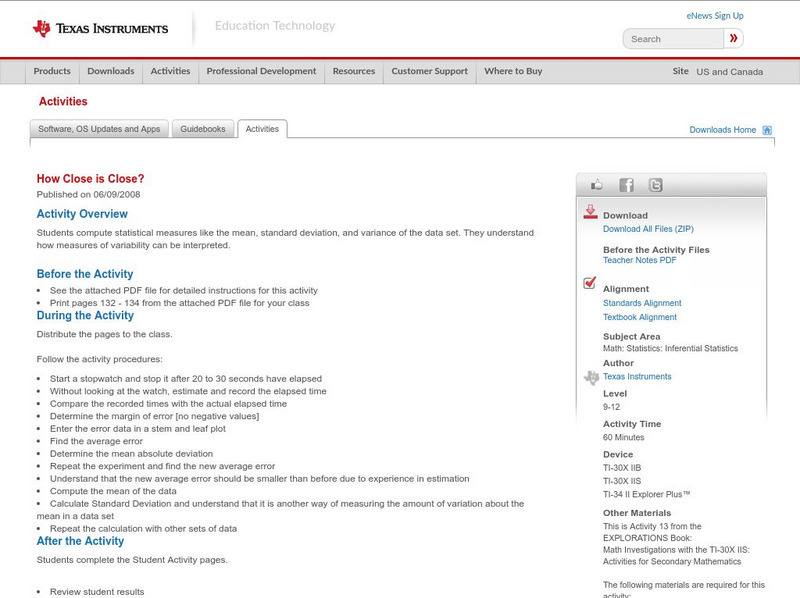
Texas Instruments: How Close Is Close?
In this activity, students compute statistical measures like the mean, standard deviation, and variance of the data set. They understand how measures of variability can be interpreted.
Texas Instruments
Texas Instruments: Simulation of Sampling Distributions
This set contains questions about simulating sampling distributions. Students see graphs of simulated distributions enabling them to reach conclusions about mean, shape, and standard deviation.
Stefan Warner and Steven R. Costenoble
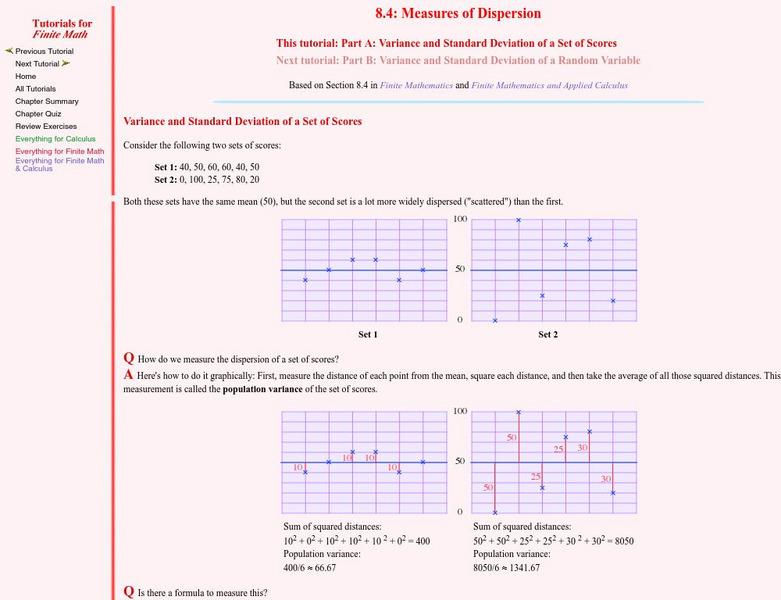
Finite Mathematics & Applied Calculus: Variance and Standard Deviation of a Set of Scores
Students learn about the variance and standard deviation of a set of scores. Topics explored are the empirical rule and Chebyshev's rule. The tutorial investigates the statistics concepts through class notes and examples. Review...
Stefan Warner and Steven R. Costenoble
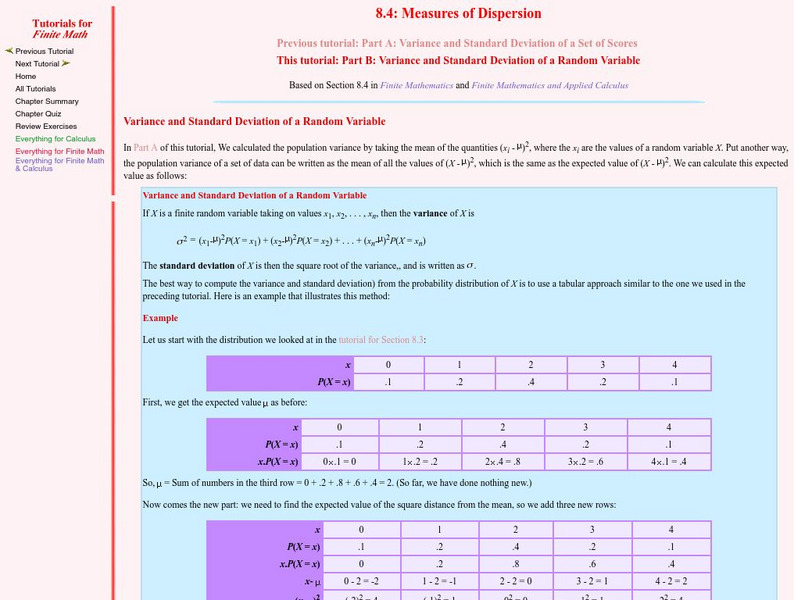
Finite Mathematics & Applied Calculus: Variance and Standard Deviation of a Random Variable
Students learn about the variance and standard deviation of a random variable. The tutorial investigates the statistics concepts through class notes and examples. Review exercises and a chapter quiz are included.
Stefan Warner and Steven R. Costenoble
Finite Mathematics & Applied Calculus: Mean, Median & Standard Deviation
Students learn about mean, median, variance, and standard deviation. The tutorial investigates the statistics concepts though class notes and examples. Review exercises are included.
Math Is Fun
Math Is Fun: Standard Normal Distribution Table
An explanation of standard normal distribution along with a table of values.
Math Is Fun
Math Is Fun: Standard Deviation Calculator
How to find the standard deviation is explained and demonstrated with this calculator. Reloading the page presents you with new numbers.
Ministry of Education and Universities of the Region of Murcia (Spain)
Ministerio De Educacion Y Ciencia: Distribuciones De Probabilidad
Learn about normal distribution, calculate odds on normal distributions and fit a set of data to a normal distribution.
Other
Online Statistics Education: Measures of Variability
Learning Objectives cover the areas of the Measures of Variability. Explanations are given for: variability, range, interquartile range, variance, and standard deviation. Examples and quizzes are also provided.
Other
Fayetteville State University: Z Distributions
The introductory paragraph explains Z-Distributions, their spread, and the ability to find certain values within the distribution. Two animated graphs are then provided as an example of the probability of the normal distribution curve.
McGraw Hill
Glencoe: Online Study Tool: Quiz on Measures of Variability
Students demonstrate advanced mathematics skills with this online quiz. The questions check understanding on measures of variability. Topics include variance, standard deviation, and frequency tables.
Science Education Resource Center at Carleton College
Serc: Understanding the Standard Deviation: What Makes It Larger or Smaller?
Learners develop a better intuitive understanding of what is meant by variability in statistics. Emphasis is placed on the standard deviation as a measure of variability.
CK-12 Foundation
Ck 12: Statistics: Applications of Variance and Standard Deviation
[Free Registration/Login may be required to access all resource tools.] Calculate the variance and standard deviation of a data set.
Math Is Fun
Math Is Fun: Standard Deviation and Variance
Standard devaition and variance are explained clearly, accompanied by an examples using the size of dogs.
Sophia Learning
Sophia: Practical Applications of the Bell Shaped Curve
Explore the bell-shaped curve and how to calculate a z score. Additional links provided to further knowledge on outliers.
Sophia Learning
Sophia: Standard Deviation
Students learn how to calculate the standard deviation by hand. Detailed examples that explore how to use the standard deviation formula are included.
Texas Instruments
Texas Instruments: Plums and the Normal Distribution
This lesson demonstrates how the calculator's built-in numeric solver can be used along with the normalcdf function to answer a variety of Normal Distribution questions.
Texas Instruments
Texas Instruments: Special Cases of Normally Distributed Data
Students perform single and two-sample t procedures to investigate special cases of normally distributed data. They explore inference for a least-square regression line, including the confidence interval.
Oswego City School District
Regents Exam Prep Center: Normal Distribution
The mathematics tutorial investigates the normal distribution. The lesson consists of class notes, calculator tips, examples, and practice problems with solutions. The teacher resource includes an activity that examines the normal...
Other
West Virginia University: Normal Distribution
The history of the normal curve and its use in statistics is presented. An Applet is provided for the user to adjust the left and right edges of the probability and see the effect on the area under the curve.
Texas Instruments
Texas Instruments: Normal Distribution
This set contains statistics questions regarding the normal curve, its distribution, and its applications. The student, using the correct calculation, transitions between observed x-values, standard z-scores, and normal curve areas.
Texas Instruments
Texas Instruments: The Normal Distribution
In this activity, students will apply the normal density function, normal cumulative distribution function, and inverse normal cumulative function to analyze a population with a normal distribution.
Texas Instruments
Texas Instruments: The Normal Distribution
Students graph normal distributions, shade desired areas, and find related probabilities. They graph Normal probability scatter plots to check the normal (linear) shape of a data distribution.


