Curated OER
Graphing at all Levels: It's a Beautiful Thing!
Mixing math and art is done in this lesson by applying graphing knowledge to create a unique piece of art. This lesson varies acording to the graphing knowledge of the artist. First, learners identify and review various types of graphing...
Curated OER
Extra Review
In this quadratic formula worksheet, learners solve and complete 22 different types of problems. First, they solve each equation by completing the square and applying the quadratic formula. Then, students graph each function provided and...
Curated OER
Exploration Sequence of Bounces
New skills are developed as students use graphing calculators and ranger technology to capture and graph the sequence of bounces a ball makes when dropped. After recording the height of four or more bounces, they use the collected data...
Curated OER
Quadratic Function Investigations
Learners perform investigation of quadratic functions while taking part in the solving of various types of problems. They explore the changes in the coefficients on the quadratic function to observe the patterns. The lesson plan includes...
Curated OER
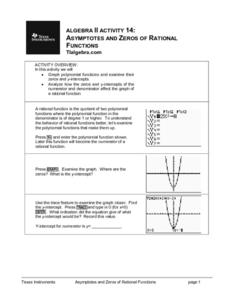
Asymptotes And Zeros of Rational Functions
Budding mathematicians graph polynomial functions and examine their zero and y-intercepts. They analyze how the zero and y-intercepts of the numerator and denominator affect the graph of a rational function. Several great additional...
Curated OER
Maximum, Minimum, Increasing, Decreasing
Learners practice with the StudyCard set on assessing real-world contexts dealing with the concepts of maximum, minimum, increasing and decreasing. They view a variety of quadratic functions and equations with their TI-83 Plus calculators.
Curated OER
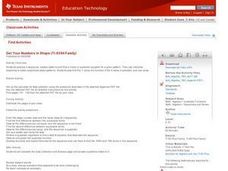
Get Your Numbers in Shape - TI-83
High Schoolers use the TI-83 calculator to produce a sequence, explore patterns and find a linear or quadratic equation for a given pattern. They use inductive reasoning to make conjectures about patterns. They find the Y-value of a...
Texas Instruments
Math TODAY for TI-Navigator System - Is Leisure Time Really Shrinking?
High schoolers organize data from the USA TODAY Snapshot, "Is leisure time really shrinking?" into two scatter plots and determine the quadratic model for each scatter plot. They determine if these graphs intersect and learn the concept...
Curated OER
Graphing Rational Functions
Learners complete an activity, included, of the information on asymptotes and intercepts. They also solve and complete eight questions on graphing rational functions, file included. Finally, pupils summarize vertical asymptotes,...
PBS
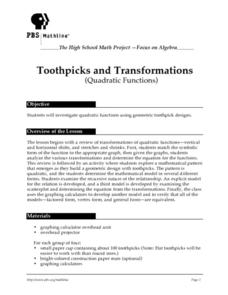
Toothpicks and Transformations
High schoolers investigate quadratic functions using geometric toothpick designs. They review transformations of quadratic functions-vertical and horizontal shifts, and stretches and shrinks. Students match the symbolic form of the...
Curated OER
Math TODAY Challenge - New Color of Money
Students read about the changes in the "new money" and then create a graph to represent various combinations of currency produced.
Curated OER
The Unit Circle
Students solve problems using the unit circle. In this precalculus lesson, students identify angles using the properties of the unit circle. They observe the trigonometric graphs and sine, cosine and tangent.
Curated OER
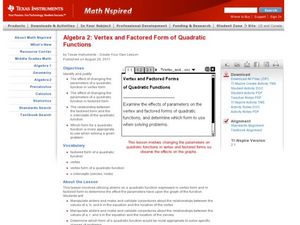
Vertex and Factored Form of Quadratic Functions
Students graph quadratic equations. In this algebra lesson, students solve quadratic equations by factoring. They identify the end behavior of the graph.
Curated OER
Comparing Exponential and Power Functions
Young scholars compare and contrast exponential and power functions. In this precalculus lesson, students identify the value of x, using the graph as a visual. They compare functions with base of greater than one, to base of less than one.
Curated OER
Rose Curve
Arcsine will be better understood and applied through prediction the number of petals on a rose curve using polar equations. Students relate rose curve to siusoidal functions using the Ti navigator.
Curated OER
Trains in Motion
Students compare two object as they find the distance between them. In this geometry lesson, students create an equation describing the distance of time as a function. They use the navigator to observe the distance.
Curated OER
Graph Polynomial Functions
Pupils explore a method of checking the sum or difference of polynomials by graphing the problem and the simplified answer and comparing the graphs.
Texas Instruments
Exploring Quadratics in Factored Form
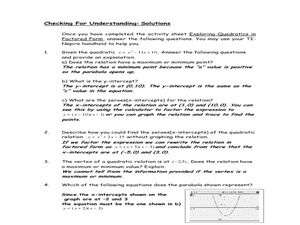
Young mathematicians explore quadratics equations in this lesson. They investigate the relationship between the standard form and factored form of quadratic equations. Learners then examine the relationship between the factoring form of...
Curated OER
NUMB3RS Activity: A Matter of Half-Life and Death
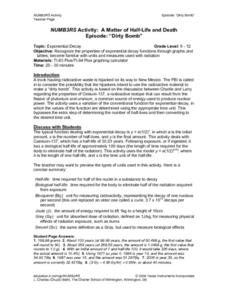
Students investigate exponential decay. Students explore the biological half-life of Cesium-137. Students investigate the Goiania Accident of 1987 which is considered one of the worst incidents in the history of the Atomic Age.
Curated OER
Match Me Plus
Have your class investigate Piecewise functions by matching a position versus time graph to the function that describe the walk.
Curated OER
More of U.S.
Explore graphical representation of a real-life data set and determine the exponential regression model for the data in your classroom. Students also compare the estimated value to the given value by determining the percent error.
Curated OER
Count the Differences
Pupils find the difference between consecutive y-values on the calculator and write an equation that fits the data. They continue finding the differences in consecutive y-values using lists on their calculator. Learners conclude as they...
Curated OER
NUMB3RS Activity: Financial Futures
High schoolers discuss the calculated risk example in Numb3rs about a businesswoman from a company that made its money trading in futures. They use a formula given by the teacher to compute the estimated value of an investment after...
Curated OER
Find Minimum and Maximum
Learners engage in a lesson about finding the values of different graphs written in the vertex form. They rewrite each quadratic equation in vertex form while graphing the equation with the visual display of a parabola that matches the...


