Curated OER
Visualizing Vectors
Investigate vectors in standard positions and use the CellSheet application on the TI calculator to find the sum of two vectors. Convert from polar to rectangular coordinates and vice versa, and show graphs of the vectors.
Radford University
“FUN-ctions” Find the Equation of a Scream
Take a function along for a ride. Given the graph of a roller coaster track, pupils determine key features of the graph such as the maximum, minimum, intervals of increase and decrease, and roots. They figure out the equation of the...
EngageNY
Advanced Factoring Strategies for Quadratic Expressions (part 2)
What do you do with a difficult-to-factor quadratic expression? This lesson plan provides the answer. Pupils learn a grouping strategy to help factor trinomials. When guess and check seems too tedious, this method is the "works every...
Illustrative Mathematics
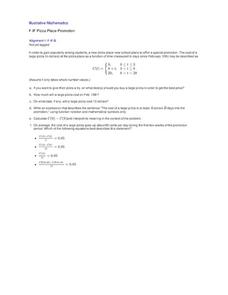
Pizza Place Promotion
The longer you wait to try the new pizza place, the more it's going to cost you! This real-world problem about how the cost of pizza varies with respect to time is a good example of how piecewise functions are used to describe...
Curated OER
Power Function Inverses
Pupils graph polynomial functions and analyze the graphs. They identify the inverse of the functions and find the domain and range. Learners will then label the functions as one to one and use the horizontal and vertical line test to...
Curated OER
Application of Function Composition
Young mathematicians solve composition of functions. They add, subtract, multiply and divide functions and then identify the domain and range of each function. An embedded animation shows three different applications of function...
Curated OER
Domain and Range 2
How do you identify the domain and range of the function? As learners find out it's as easy as creating a graph. They'll identify the domain and range of a relation from its graph, write symbolic expressions describing the relationship...
Curated OER
Characteristics of Exponential Functions
What can an upper grader do with an exponential function? They can solve and graph it, identify its important characteristic, and differentiate graphs based on shifts in graph bases that are greater or less than one. This 45 minute...
Curated OER
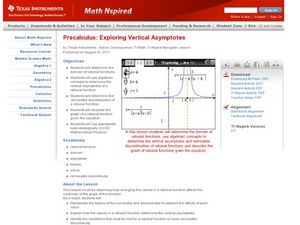
Exploring Vertical Asymptotes
Scholars identify the domain of a rational function in this precalculus activity. They identify the removable discontinuity and label what will make the denominator zero. Learners also describe properties of the graph as it relates to...
Curated OER
Cell Phone Range
Here is a 15 minute activity that can be used as review, a warm, or as a quick example of how to relate functions to the real world. Learners complete an application activity and draw conclusion about functions then discuss open and...
Curated OER
Graphic Designing with Transformed Functions
Teach your class how to transform a graph! By identifying the domain and range of the functions, high schoolers can observe the parabola and find the vertex of the transformed graph.
Curated OER
Exploring Power Functions 2
Young mathematicians learn to write algebraic equations. They solve and graph different polynomial functions with different powers. They then graph radicals and identify the domain and range.
Curated OER
Comparing Linear and Exponential Functions
Teach your class how to differentiate between linear and exponential functions. They use exponential properties to solve problems, graph them using the TI-Navigator, and make comparisons.
Curated OER
Graph Logarithms
Mathematicians graph logarithmic equations. Teach your young scholars how to identify the intercepts of logarithmic equations and tell whether the function is increasing or decreasing. They find the domain and range of each function.
Curated OER
Domain and Range
Your class will grasp the concept of domain-and range on a graph by using their TI navigator to graph their lines. They observe the effect of a function and non-functions based on the domain and range.
Curated OER
Domain and Range of Exponential Functions
Have your class find the domain and range for each function. High schoolers graph equations using the TI. They find all the x and y values as they relate to the domain and range.
Curated OER
Exponential Functions f(x) = abx
Students define exponential functions and graph the equation. In this algebra instructional activity, students discuss exponential growth and decay as they graph their functions. They differentiate between the base of growth and decay.
Curated OER
Dog Days or Dog Years?
In need of some algebraic fun with real world implications?Learners use ordered pairs, a table of values and a scatter plot to evaluate the validity of several real world data sets. The class focuses on dog ages in human years, domain,...
Curated OER
Volumes of Rectangular Prisms
Students determine the volume of a rectangular prism. They then maximize and minimize the volume given variable side lengths. Finally, they factor the volume equation to determine the side lengths.
Curated OER
Domian and Range of Graphs
High schoolers determine the domain and range of various graphs using a graphing calculator. Given a set of graphs to analyze, learners calculate the range and domain of the graphs by plotting the graphs on their calculators. Downloads...
Alabama Learning Exchange
The Composition of Seawater
Young scholars explore the concept of finding the composition of seawater. In this finding the composition of seawater instructional activity, students make a saturated salt water solution. Young scholars discuss why there is variation...


