Hi, what do you want to do?
Mathed Up!
Two Way Tables
When presented with categorical data, a two-way frequency table is a great way to summarize the information. Pupils organize categorical data using a two-way table, then use the tables to determine missing data and to calculate simple...
Khan Academy
Khan Academy: Video Games and Violence
In this video lesson students look at a set of data, transfer the data into a two-way table and then use that table to make inferences about the data.
Virtual Nerd
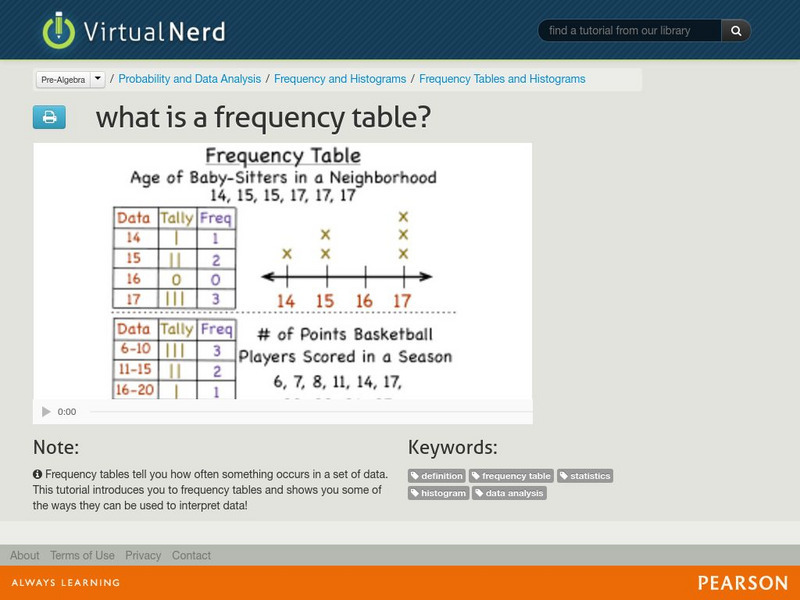
Virtual Nerd: What Is a Frequency Table?
Frequency tables tells you how often something occurs in a set of data. Watch this video for examples of frequency tables. [6:44]
Virtual Nerd
Virtual Nerd: How Do You Make a Frequency Table?
How can you visually show what occurs most often in a set of data? A frequency table is one way! Watch the step by step process on how to make a frequency table from a data set. [8:06]
Annenberg Foundation
Annenberg Learner: Against All Odds: Histograms
Meteorologists use histograms to map when lightning strikes and this visualization technique helps them understand the data in new ways. [9:42]
PBS
Pbs Learning Media: Real Life Math: Baseball
Watch and listen as the assistant general manager of a major league baseball team explains how he uses math in this video from KAET, Arizona PBS. A lesson plan and handouts are included. [7:43]
Virtual Nerd
Virtual Nerd: What Is a Frequency Table?
Video serves as an introduction to frequency tables which tell you how often something occurs in a set of data. [6:44]
Khan Academy
Khan Academy: Two Way Relative Frequency Tables
Demonstrates how to develop a two-way table of relative frequencies in an example problem about accidents and the types of vehicles involved. [4:27]
Virtual Nerd
Virtual Nerd: How Do You Find Relative Frequency?
Relative frequency is how often something happens divided by all the outcomes. Watch this tutorial to learn all the steps needed to find the relative frequency. [3:25]
Imagine Learning Classroom
Learn Zillion: Construct a Two Way Table From a List
In this lesson, students learn how to construct a two-way table by collecting and organizing data from a verbal description. [4:14]
Khan Academy
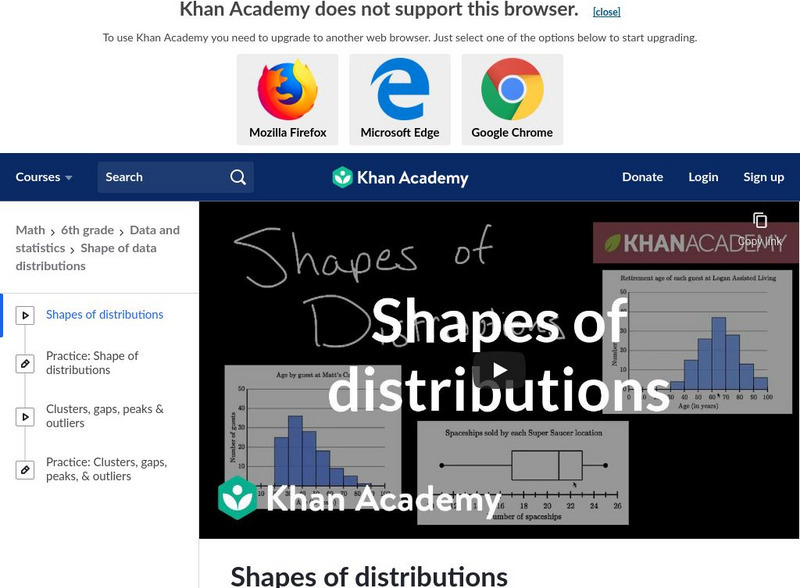
Khan Academy: Shapes of Distributions
This video discusses how to interpret a data display by looking at patterns and anomolies in the shape of its distribution. [5:06]
Khan Academy
Khan Academy: Analyzing Trends in Categorical Data
Sal solves an example where he is asked to calculate relative frequencies and analyze trends in categorical data.
Sophia Learning
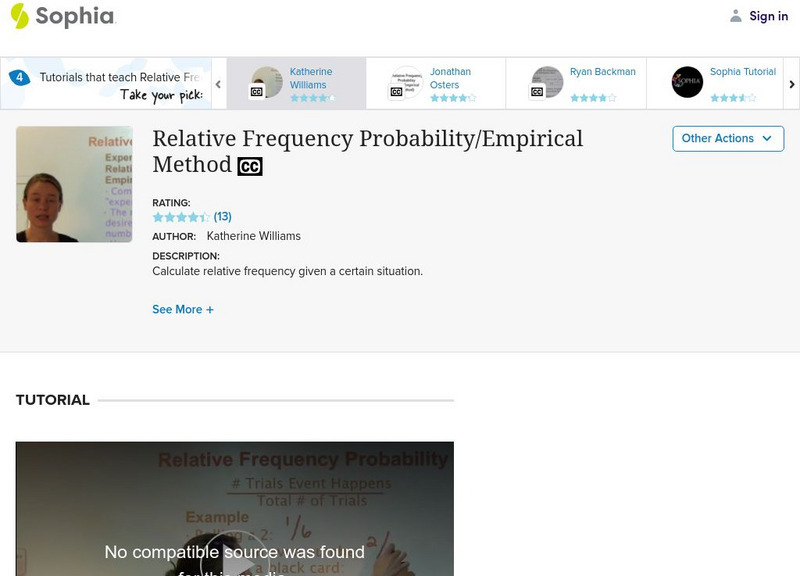
Sophia: Relative Frequency Probability/empirical Method: Lesson 2
This lesson will introduce experimental and subjective definitions of probability. It is 2 of 3 in the series titled "Relative Frequency Probability/Empirical Method." Includes short quiz. [7:12]
Sophia Learning
Sophia: Representing With Box and Whisker Plots: Lesson 2
This lesson demonstrates how a box-and-whisker plot can be used to represent data. It is 2 of 3 in the series titled "Representing with Box-and-Whisker Plots."
Khan Academy
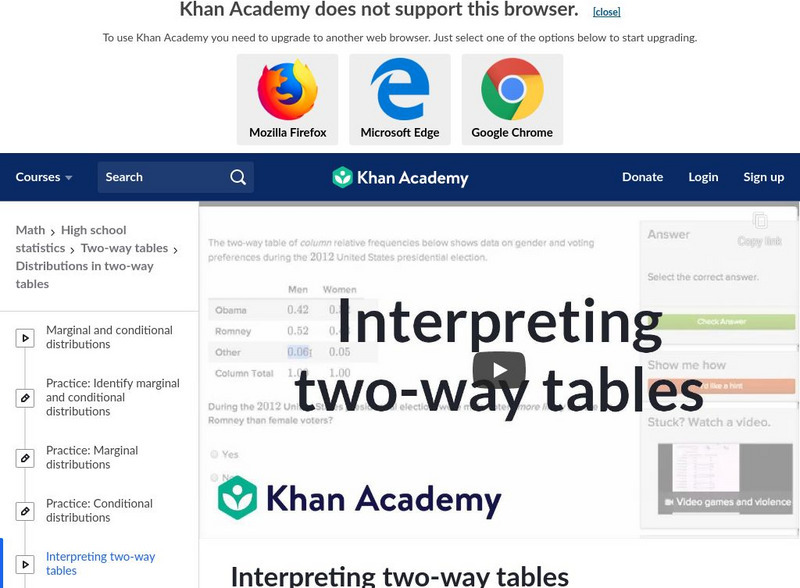
Khan Academy: Interpreting Two Way Tables
Demonstrates how to interpret information in a two-way table of relative frequencies. [1:44]
Shmoop University
Shmoop: Histograms
Explore how to organize data with histograms through this video. [1:21]
Sophia Learning
Sophia: Two Way Tables/contingency Tables: Lesson 3
This lesson will explain two-way tables. It is 3 of 3 in the series titled "Two-Way Tables/Contingency Tables." A transcript accompanies the video. [3:45]


