Hi, what do you want to do?
Virtual Nerd
Virtual Nerd: How Do You Graph a Linear Equation by Making a Table?
See how to graph a function by making a table of values that fir your equation. [3:24]
Imagine Learning Classroom
Learn Zillion: Identify a Function From a Graph
In this lesson, you will learn how to identify a function by analyzing its graph. [3:39]
Imagine Learning Classroom
Learn Zillion: Determining the Constant Rate of Change
In this video lesson, you will learn how to calculate the rate of change of a linear function by examining the four representations of a function. [5:36]
Imagine Learning Classroom
Learn Zillion: Lesson Video for 'Describe Rate of Change Using Graphs'
In this lesson, you will learn how to describe the rate of change in a function by analyzing graphs. [5:04]
Virtual Nerd
Virtual Nerd:how Can You Tell if a Function Is Linear or Nonlinear From a Graph?
Watch this tutorial to discover how to tell if a function is linear or nonlinear from a graph. [3:34]
Other
Algebra2go: Graphing Linear Equations; Part 2
Continued from part 1. Video tutorial provides examples that demonstrate how to graph linear equations. [8:11]
Khan Academy
Khan Academy: Algebra: Recognizing Linear Functions
This video demonstrates how to determine if a function is linear or not based on a table of x and y values. It also demonstrates how to graph the values in order to check if the function is linear or not. [4:01]
Khan Academy
Khan Academy: The Coordinate Plane: Recognizing Linear Functions
Video showing how to determine whether a set of data points represents a function that is linear or nonlinear.
Khan Academy
Khan Academy: Graphing Solutions to Equations: Interpreting Linear Graphs
This video demonstrates real-life situations that might result in a linear relationship and shows what this relationship would look like on a graph.
Khan Academy
Khan Academy: Linear and Nonlinear Functions (Example 3)
This video shows you how to find the missing value to make the table to represent a linear function.
Khan Academy
Khan Academy: Linear and Nonlinear Functions (Example 2)
Find out when can you solve a problem using linear or nonlinear equation.
Khan Academy
Khan Academy: Linear and Nonlinear Functions (Example 1)
Recognize if a given table contain a linear equation.
Khan Academy
Khan Academy: Algebra: Interpreting Linear Graphs
This video demonstrates real-life situations that might result in a linear relationship and shows what this relationship would look like on a graph. It also identifies when x and y values vary directly and when x and y values vary...
Sophia Learning
Sophia: Finding Rates of Change in Linear Relationships: Lesson 4
This lesson demonstrates how to find the rate of change in functions with linear relationships. It is 4 of 5 in the series titled "Finding Rates of Change in Linear Relationships."
Sophia Learning
Sophia: Finding Rates of Change in Linear Relationships: Lesson 5
This lesson demonstrates how to find the rate of change in functions with linear relationships. It is 5 of 5 in the series titled "Finding Rates of Change in Linear Relationships."
Sophia Learning
Sophia: Finding Rates of Change in Linear Relationships: Lesson 1
This lesson demonstrates how to find the rate of change in functions with linear relationships. It is 1 of 5 in the series titled "Finding Rates of Change in Linear Relationships."
Sophia Learning
Sophia: Application of Percent of Change
Here we look at how to apply percent of change in a real world situation through the use of a word problem.
Sophia Learning
Sophia: Cost as a Linear Function
In this lesson, students will learn Cost as a Linear Function
Sophia Learning
Sophia: Identical Rates of Change
In this lesson, students will learn Identical Rates of Change
Sophia Learning
Sophia: Finding Rates of Change From Tabular Data
Determine the rate of change from tabular data then check understanding with a short quiz. [2:02]
Study Pug
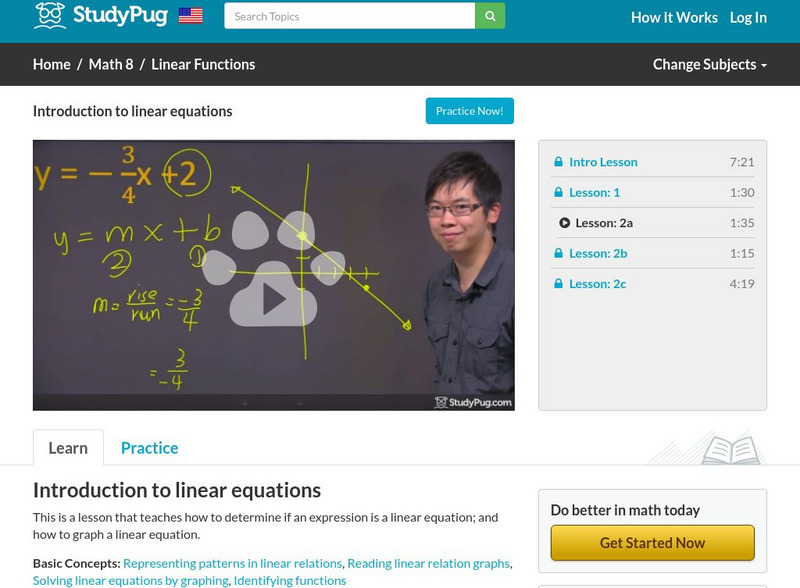
Study Pug: Introduction to Linear Equations
This video teaches how to determine if an expression is a linear equation; and how to graph a linear equation. [1:35]


