Hi, what do you want to do?
Wolfram Research
Wolfram Math World: Population
MathWorld offers a number of related meanings for population in the realm of statistics.
University of Georgia
University of Georgia: Definitions in Statistics
This site contains definitions to use in statistics and ways to collect data.
TED Talks
Ted: Ted Ed: Hans Rosling Shows the Best Stats You've Ever Seen
Explore collected data in regards to life expectancies, family size, and finances through out the world and the various ways the data has been displayed.
Texas Instruments
Texas Instruments: Data Analysis and Probability
In this activity students explore the basics in data analysis and probability.
Texas Instruments
Texas Instruments: Getting Started With Probability Simulations App
Explore probability theory with interactive animation that simulates the rolling of dice, tossing of coins and generating random numbers. Evaluation options include bar graphs, table of trials data, settings for specifying the number of...
Texas Instruments
Texas Instruments: Number Cube Sums
Students explore experimental probability and patterns in fractions, decimals, and percents by rolling two number cubes and recording and analyzing the sums that come up.
Texas Instruments
Texas Instruments: Making Conjectures and Planning Studies
This activity introduces students to the concept of collecting and analyzing data and using conjectures to formulate new questions.
Texas Instruments
Texas Instruments: How Do You Measure Up?
In this activity, students graph scatter plots to investigate possible relationships between two quantitative variables. They collect data and analyze several sets of data pairing the two quantities.
Texas Instruments
Texas Instruments: Survey Project
Students survey other students (numerical and non numerical data) and calculate measures of central tendency (if possible) of data and make regular box-an-whisker plots and outlier box-and-whisker plots to analyze the data.
The Math League
The Math League: Ratio and Proportion
This tutorial provides definitions and examples of ratios and proportions and features comparing ratios and converting rates.
Beacon Learning Center
Beacon Learning Center: Leap Frog Experiment
Students design an experiment, collect information using tree diagrams, and interpret the results using charts in this interactive web lesson.
Beacon Learning Center
Beacon Learning Center: All That Data 2
Students describe graphs and explore range, measures of central tendency, and distribution in this interactive web lesson.
Beacon Learning Center
Beacon Learning Center: Arrange a Party
Students use problem solving skills to calculate the range for a set of data and plan a party for friends.
Other
42e Xplore: Statistics and Probability
An extensive collection of links on statistics and probability can be found here! Discussions ranging from the basics of stats through more complex data analysis. Topics are broken down into sections for teachers, students, WebQuest...
Math Is Fun
Math Is Fun: Mathopolis: Quartiles Practice
Multiple-choice practice problems that review quartiles. Incorrect answers are corrected with short tutorials.
Scholastic
Scholastic: Study Jams! Math: Data Analysis: Mean Average
Students can watch a step by step lesson showing how to determine the mean. Then sing along with a song and test your knowledge of understanding when you have completed the activities.
Other
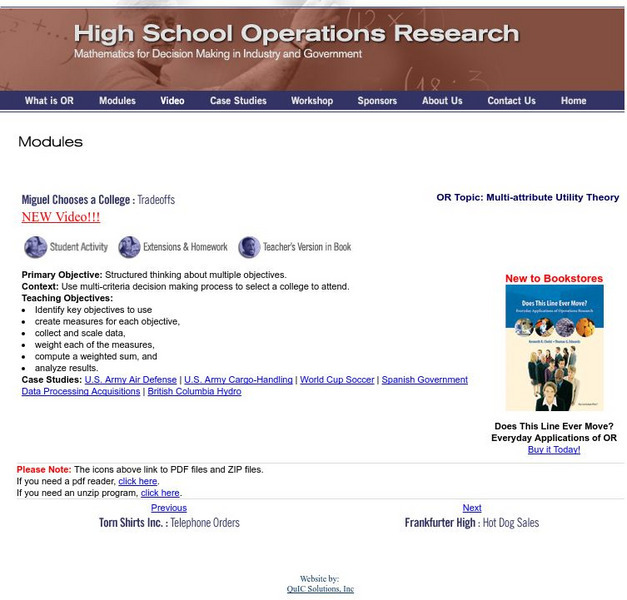
Hsor.org: Miguel Chooses a College: Tradeoffs
Use several strategies and criteria to help Miguel determine the college for him.
McGraw Hill
Glencoe Mathematics: Online Study Tools: Measures of Central Tendency
This site gives a short interactive quiz which allows students to self-assess their understanding of the concept of measuring central tendency.
McGraw Hill
Glencoe Mathematics: Online Study Tools: Statistics and Probability
The online test demonstrates knowledge of the concepts used in Algebra I. The multiple choice questions assess students on statistics and probability. Topics include biases, samples, and surveys.
University of Cambridge
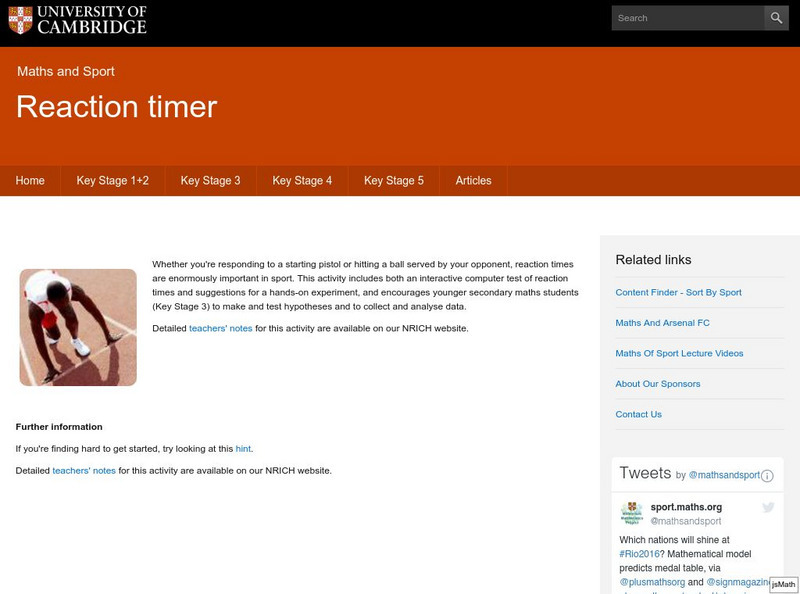
University of Cambridge: Maths and Sports: Reaction Timer
Whether you're responding to a starting pistol or hitting a ball served by your opponent, reaction times are enormously important in sport. This activity includes both an interactive computer test of reaction times and suggestions for a...
Illustrative Mathematics
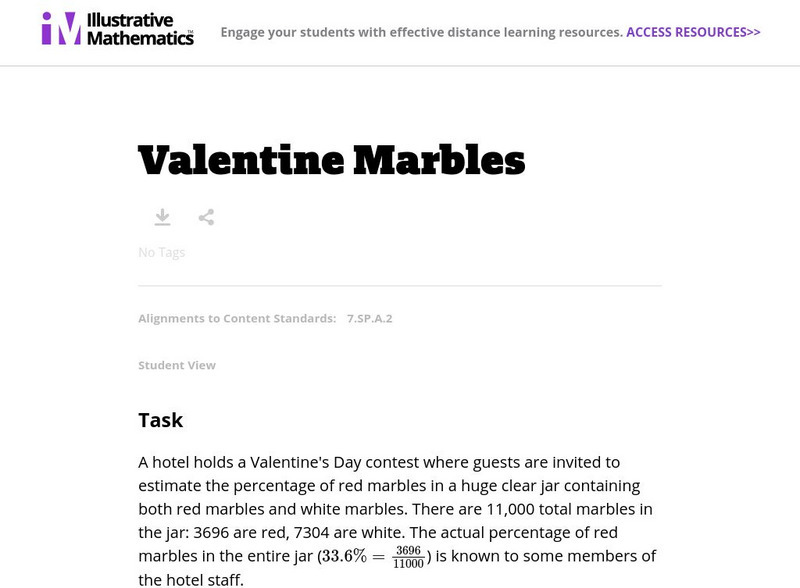
Illustrative Mathematics: Valentine Marbles
Explore estimation through this lesson plan designed to engage students.
National Council of Teachers of Mathematics
Nctm: Figure This: Beating Heart
Do you know how long it takes your heart to beat 100 times? Test your estimation and number sense skills with this problem-solving challenge. A one-page activity taken from the NCTM Math Challenges for Families Collection. Hints and...
Mangahigh
Mangahigh: Data: Random and Biased Events
Students explore the concept of random and biased events by working through an online tutorial and then attempting a ten question quiz that increases in difficulty as questions are answered correctly.
Mangahigh
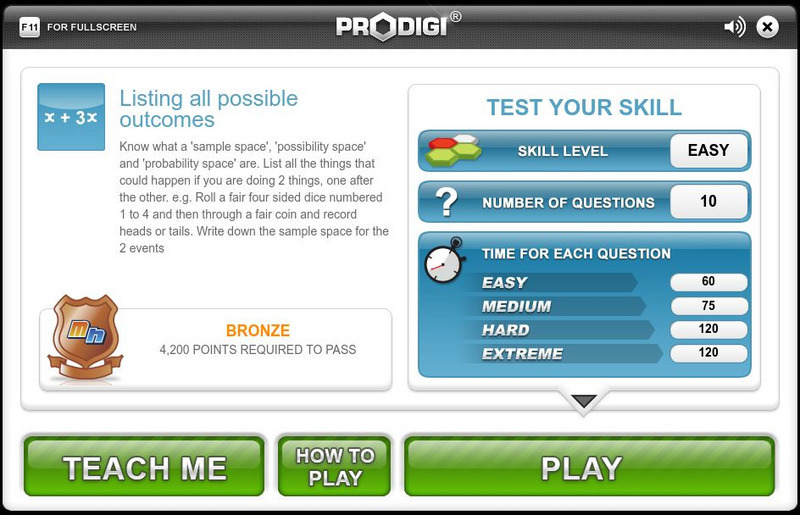
Mangahigh: Data: Listing All Possible Outcomes
Students learn about the concept of possible outcomes by exploring a tutorial. They can then test their knowledge by taking a ten question assessment that increases in difficulty as they correctly answer questions.


