Hi, what do you want to do?
Sophia Learning
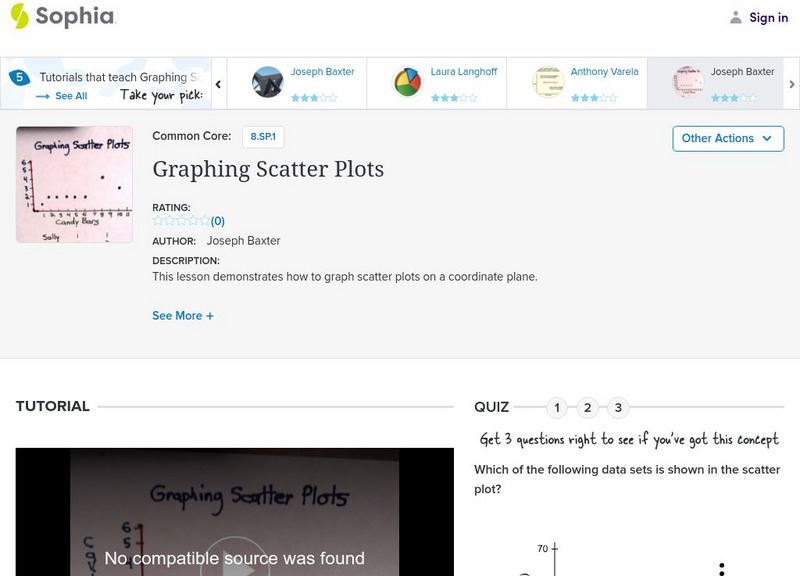
Sophia: Graphing Scatter Plots
Create a scatter plot by displaying data on a coordinate plane. Assess understanding with a quiz.
Sophia Learning
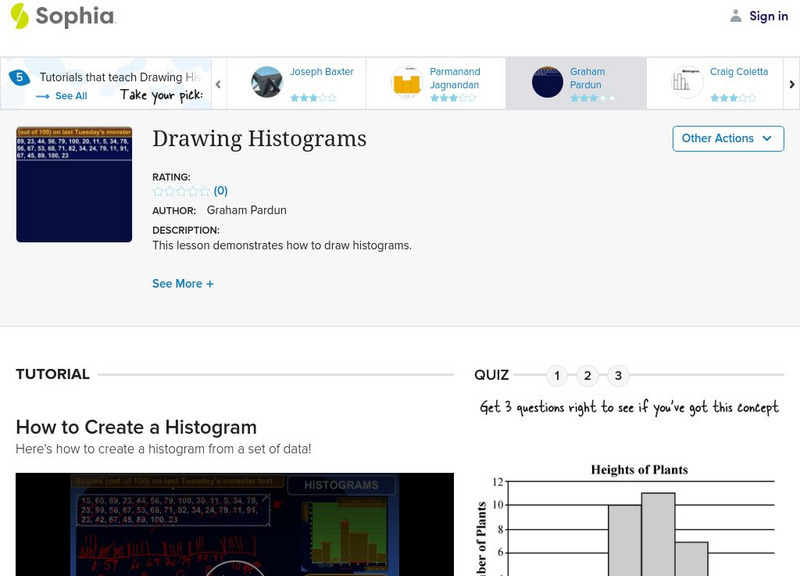
Sophia: Drawing Histograms
Given a data set, explore how to create a histogram. Complete quiz to assess understanding. [9:42]
Virtual Nerd
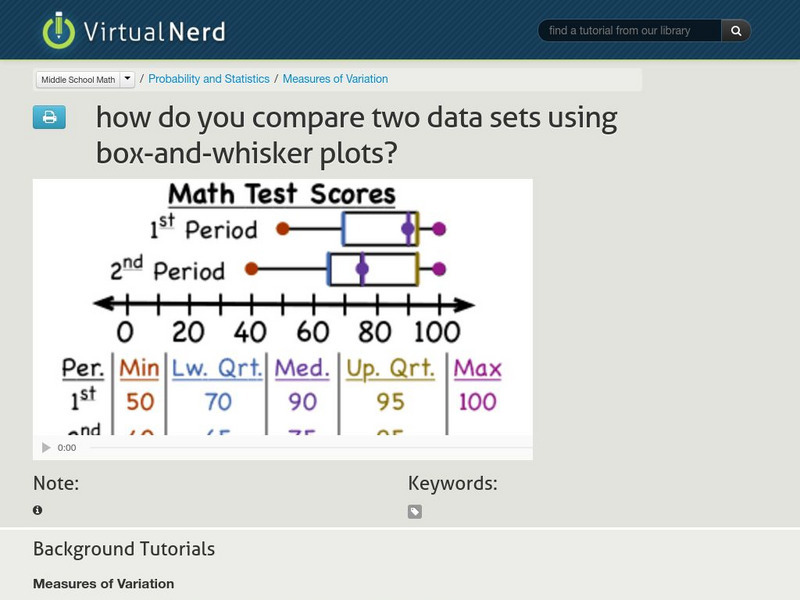
Virtual Nerd: How Do You Compare Two Data Sets Using Box and Whisker Plots?
How do you describe the similarities and differences between two data sets using box-and-whisker plots? This video gives you a great explanation using an example of test scores from two different math classes. [5:27]
Math Mammoth
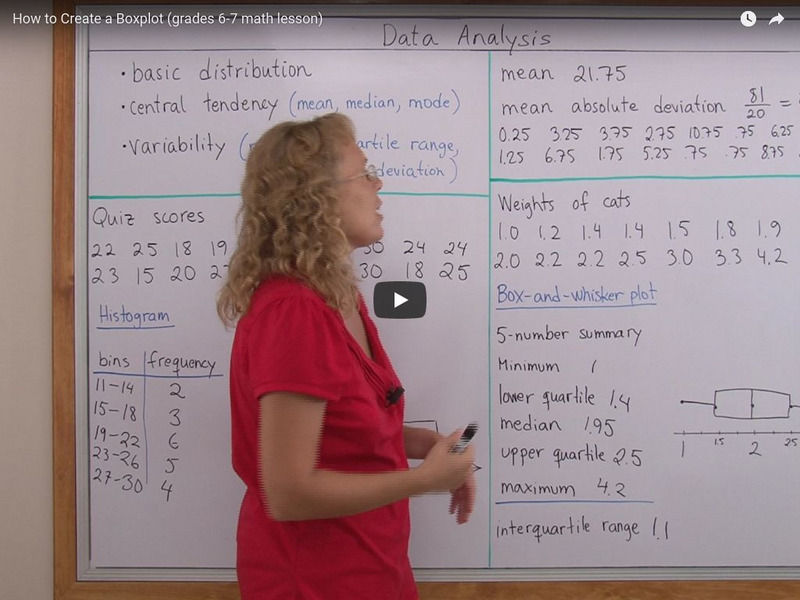
Math Mammoth: How to Create a Boxplot
This lesson explains how to draw a box-and-whisker or box plot, and the terms used to describe one. [4:30]
Khan Academy
Khan Academy: Statistics: Reading Box and Whisker Plots
Video demonstration of reading a box-and-whisker plot to find the range, median and quartiles and to answer a question. [3:18]
Khan Academy
Khan Academy: Algebra: Fitting a Line to Data
This video utilizes Microsoft Excel to demonstrate how to plot data in the form of a scatter plot and then create a line of best fit. It also shows how to make a prediction based on the linear progression of the data. The software does...
Khan Academy
Khan Academy: Algebra: Histograms
Video shows example of creating a histogram for data by first creating a frequency table. [6:08]
Loyola University Chicago
Math Flix: Graphs: Scatter Plot Creating
This QuickTime movie provides an opportunity to create a graph that is a scatter plot. A pdf worksheet is available by clicking on the hyperlink at the bottom of the page. As you watch and listen to the teacher and student interact it...
Loyola University Chicago
Math Flix: Graphs: Box and Whisker Plots
This video provides an opportunity to create a Box and Whisker Plot. A pdf worksheet is available by clicking on the hyperlink at the bottom of the page. As you watch and listen to the teacher and student interact it helps clarify the...
Sophia Learning
Sophia: Interpreting Box and Whisker Plots
This video lesson demonstrates how to interpret box-and-whisker plots to find outliers.
Sophia Learning
Sophia: Line Plots Tutorial
This video lesson introduces line plots as a way of graphing data. Includes several multiple-choice questions to check your understanding. [3:00]


