Scholastic
Study Jams! Bar Graphs
Mia teaches Sam how to create a bar graph, including forming a title, creating and labeling the axes, choosing a scale, and entering data. After viewing, data analysts can test themselves with seven follow-up questions and review...
PBS
Pbs Learning Media: Inventing Bar Graphs
The CyberSquad creates a bar graph representing the amount of bugs that are infecting the Cybrary in this video from Cyberchase.
Khan Academy
Khan Academy: Creating Picture and Bar Graphs 1
Sal creates and interprets bar and picture graphs. Includes a video, transcript, and question and answer section. [4:57]
PBS
Pbs Learning Media: Attention to Scaling
In this video segment from Cyberchase, the CyberSquad adds a scale to their bar graph to give a more accurate picture of the bug infestation at the Cybrary.
Khan Academy
Khan Academy: Create Picture and Bar Graphs 1
Demonstrates how to make bar and picture graphs and then read them. [4:57]
Khan Academy
Khan Academy: Reading Bar Graphs: Movies
Models how to read bar graphs to answer questions about them. [3:49]
Khan Academy
Khan Academy: Picture Graphs
A picture graph, or pictograph, is a graph used to display information that uses images or symbols to represent data. This video demonstrates how to interpret a pictograph of where mice live on a farm. Includes a video, transcript, and...
Khan Academy
Khan Academy: Interpreting Bar Graphs: Colors
Lindsay from Khan Academy solves a multi-step word problem using a bar graph. [4:04]
Khan Academy
Khan Academy: Interpreting Picture Graphs: Notebook
Lindsay from Khan Academy solves a multi-step word problem involving a picture graph. [3:44]
Loyola University Chicago
Math Flix: Graphs: Literature "Tiger Math"
This QuickTime movie uses the children's book, "Tiger Math" as a starting point for using graphs to tell a story. As you watch and listen to the teacher and student interact it helps clarify the thinking behind applying this concept.
Sophia Learning
Sophia: Bar Graphs Tutorial
This video lesson introduces and defines bar graphs, discussing their uses and construction. Includes several multiple-choice questions to check your understanding. [3:13]
Khan Academy
Khan Academy: Reading Bar Graphs: Dog Bones
Models how to extract information from a bar graph. [2:56]
Math Playground
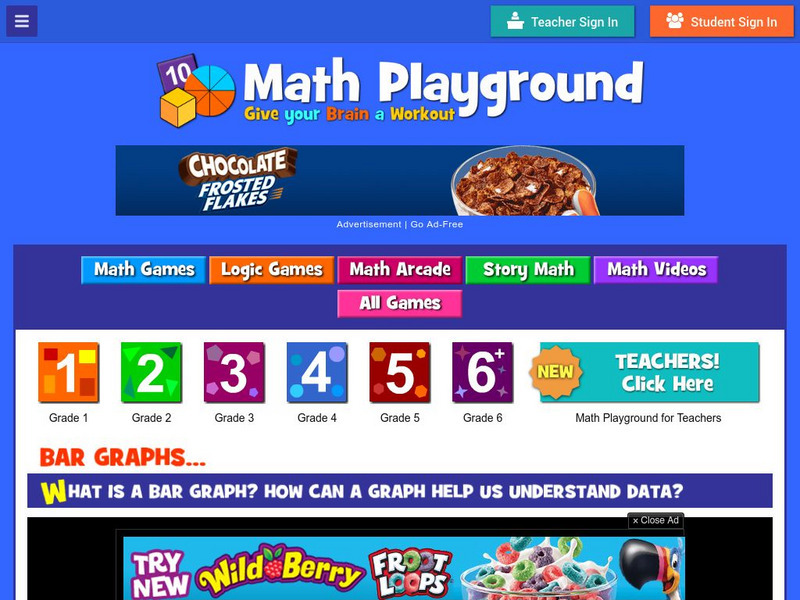
Math Playground: Bar Graphs
A video explaining how to construct and read a bar graph. [3:50]
Loyola University Chicago
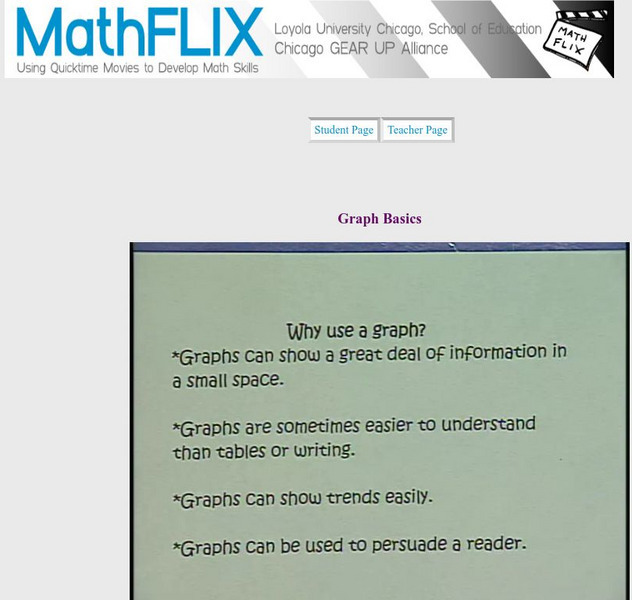
Math Flix: Graphs: Basics
This QuickTime movie reviews basic concepts for graphs. As you watch and listen to the teacher and student interact it helps clarify the thinking behind applying this concept.
Loyola University Chicago
Math Flix: Graphs: Pictogram, Bar Graph & Line Graph
This QuickTime movie provides examples of pictograms, bar graph, and line graph. A pdf worksheet is available by clicking on the hyperlink at the bottom of the page. As you watch and listen to the teacher and student interact it helps...
Loyola University Chicago
Math Flix: Graphs: Bar Graph Histograms
This QuickTime movie introduces a specific type of bar graph called histograms. As you watch and listen to the teacher and student interact it helps clarify the thinking behind applying this concept.


