US Department of Education
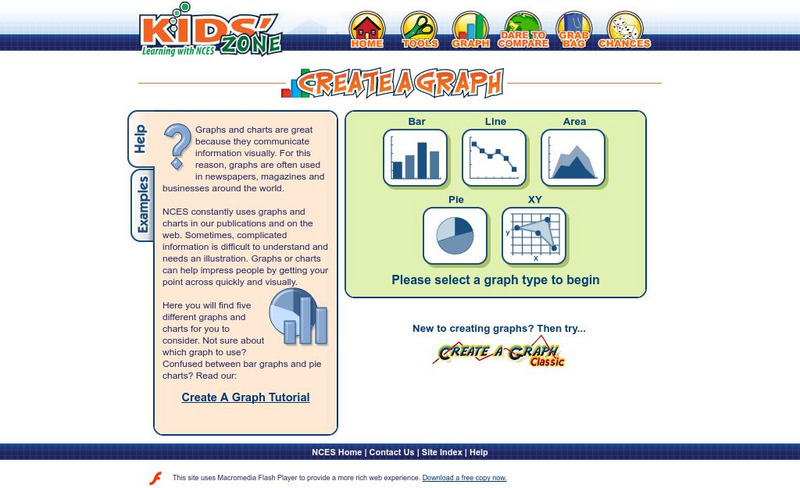
Nces Kids' Zone: Create a Graph
Resource from the National Center for Education Statistics allows you to create great bar graphs. Simply enter your information, choose appropriate colors, and voila!- you have a beautiful graph you can turn put into your report!
US Department of Education
National Center for Education Statistics: Create a Graph Tutorial
This tutorial walks students through how to create different types of graphs using the Create a Graph tool available on the website. Covers bar graphs, line graphs, pie charts, area graphs, scatter plots, and dependent and independent...
E-learning for Kids
E Learning for Kids: Music: Presenting Data
Can you help Grace organize a dance show for her school?
US Department of Education
Nces Kids: Creating an Area Graph
This is where you will find step by step directions explaining how to create an area graph. Complete each step and click on the next tab. Directions are simple and clear.
US Department of Education
Nces: Create a Graph: Kids Zone
Make your own pie, bar, line, area or XY graph with this interactive tool. Look for examples of graphs already created from data collected by the National Center for Education Statistics. Complete with a graphing tutorial.
Shodor Education Foundation
Shodor Interactivate: Bar Graph Sorter
An applet allows students to sort shapes into a bar graph by color and shape. The learning resource consists of the activity, instructions, instructor notes, and additional resources.
Texas Instruments
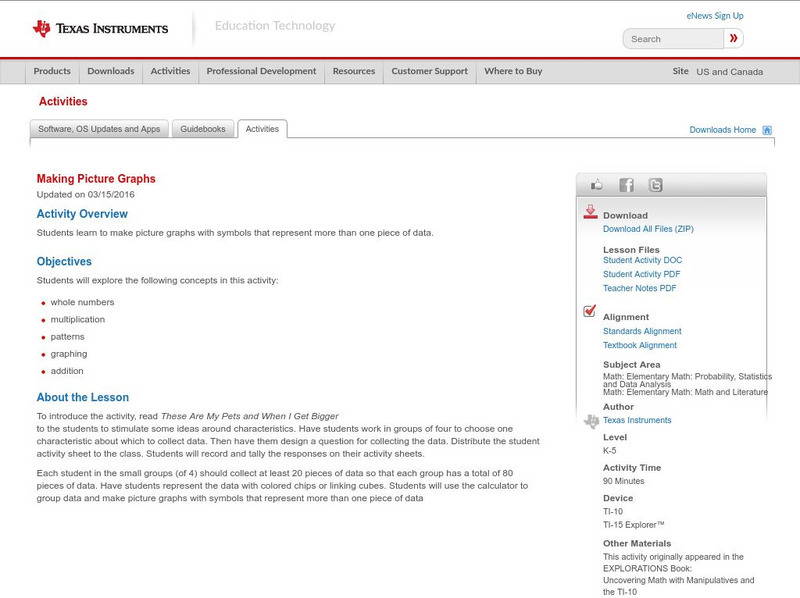
Texas Instruments: Making Picture Graphs
Students learn to make picture graphs with symbols that represent more than one piece of data.
Primary Resources
Primary Resources: Tally and Bar Charts
Lots of good materials for teaching about tally marks and bar graphs.
SMART Technologies
Smart: Bar Graphs
This smart note book explains reading bar graphs, the parts of a bar graph, the steps to produce a bar graph and allows classes to input data a produce some bar graphs.
University of Texas at Austin
Mathematics Teks Toolkit: And We Go Around
Collect and display data using a bar and circle graph to explore fractions and percents.
Beacon Learning Center
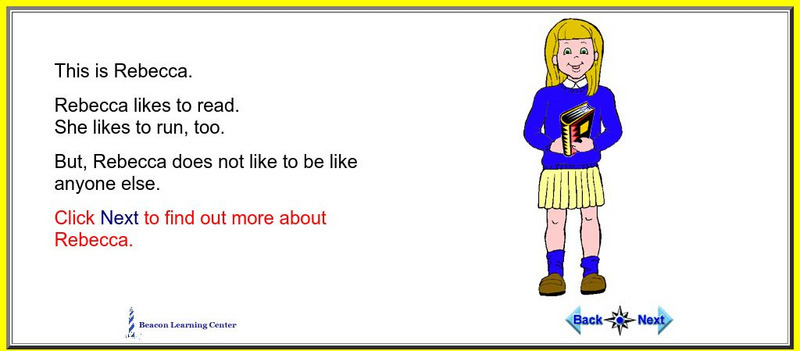
Beacon Learning Center: I Am Special
An interactive web lesson introduces students to picture graphs. It also allows them to practice creating and interpreting the graphs.
Beacon Learning Center
Beacon Learning Center: Kinds of Graphs
An interactive web lesson introduces five types of graphs to students and allows them to practice matching the names to examples.
Beacon Learning Center
Beacon Learning Center: I Am Special
The activity investigates picture graphs. Learn about Rebecca through picture graphs.
Beacon Learning Center
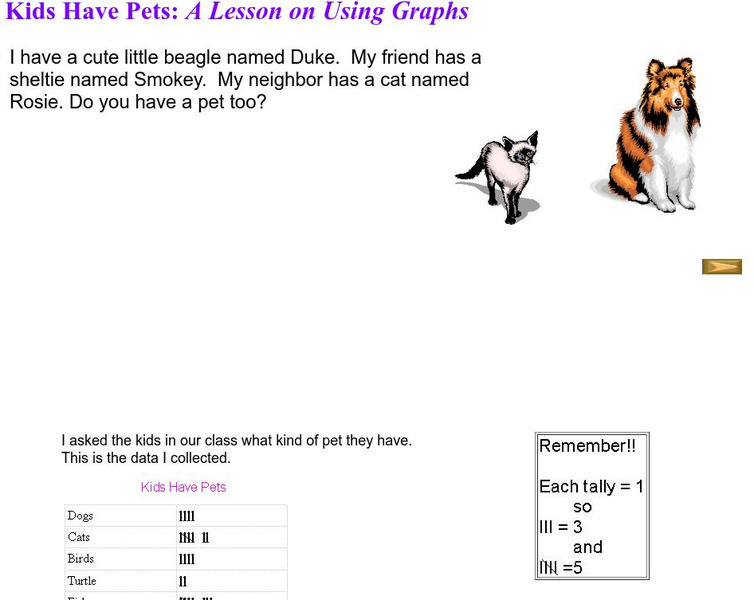
Beacon Learning Center: Kids Have Pets
The activity investigates bar graphs. Students complete a lesson using graphs to examine pets.
Beacon Learning Center
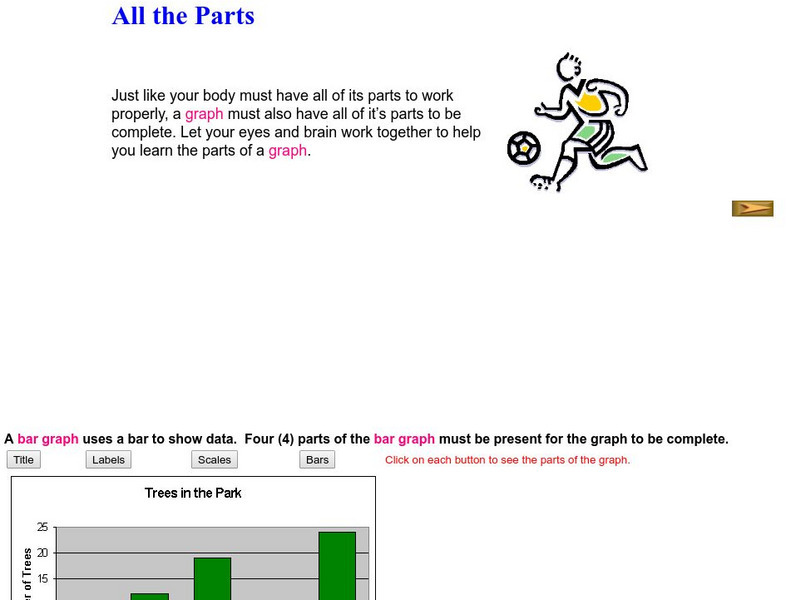
Beacon Learning Center: All the Parts
The activity investigates bar graphs. Students learn about all the parts of a graph.
Beacon Learning Center
Beacon Learning Center: How It All Stacks Up
The resource examines how to use bar graphs to organize and display data.
Beacon Learning Center
Beacon Learning Center: Play Ball
An interactive web lesson shows examples of pictographs and challenges students to answer questions about the graphs.
Beacon Learning Center
Beacon Learning Center: All That Data
Students analyze data by finding the mean, median, mode, and range of a set of numbers. Line plots, bar graphs, and circle graphs are also included in this lesson.
The Franklin Institute
Frankin Institute Online: Group Graphing
This site from The Franklin Institute explores how to make a simple graph using a spreadsheet to portray survey data. It also gives a set of interesting sports-related web sites so that students can get statistical inforamtion.
ABCya
Ab Cya: Fuzz Bugs Graphing
Students drag the fuzz bugs into the correct container to create a bar graph that is used to compare data.
Math Is Fun
Math Is Fun: Data Graphs
Create and customize a bar graph, line graph, or pie chart based on a set of data and print it out.
ClassFlow
Class Flow: Data Analysis Using Graphing
[Free Registration/Login Required] This flipchart allows students to analyze data using appropriate graphs, including pictographs, histograms, bar graphs, line graphs, circle graphs, and line plots introduced earlier, and using...
Khan Academy
Khan Academy: Make Bar Graphs 1
Practice creating bar graphs (bar charts) from data sets. Students receive immediate feedback and have the opportunity to try questions repeatedly, watch a video or receive hints.
Math Is Fun
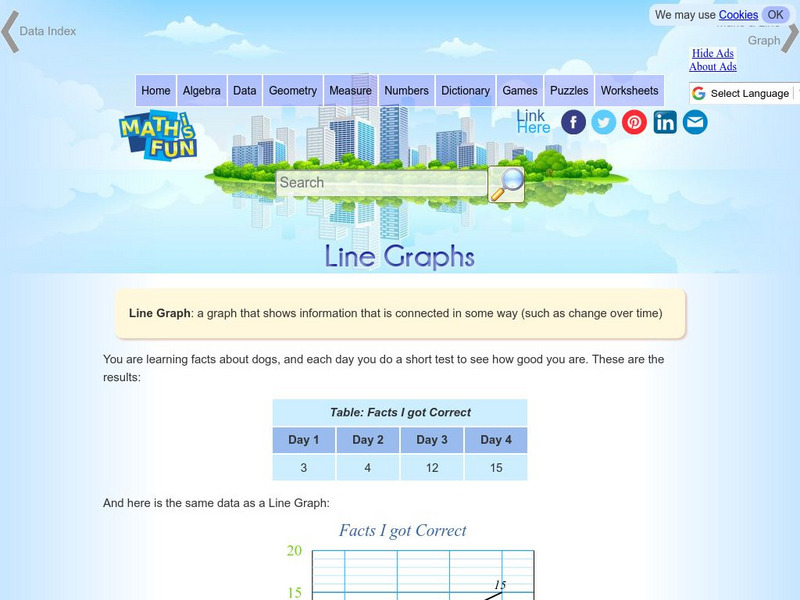
Math Is Fun: Line Graphs
Explains, with examples, what a line graph is and how to construct one. Includes a set of practice questions.
