Hi, what do you want to do?
Curated OER
Let the River Run
Pupils examine deposits found in a river in this science lesson. They collect data of sediment deposit found in the Mississippi river, then graph and analyze their data using the TI.
Texas Instruments
Land Erosion - Running Off With Soil
Learners evaluate the relationship between rainfall and runoff of a small island for one year. In this rainfall vs. runoff lesson, students analyze the relationship between the rainfall and the runoff on Barro Colorado Island over a...
Curated OER
Biodiversity and Ecosystems
Middle schoolers differentiate between biotic and abiotic factors in this science lesson. Learners collect data for the experiment and analyze the data after graphing it using the CBL 2. This experiment is split into two different...
Curated OER
The Disappearing Kelp Forest
Learners observe the effect "El Nino" left on kelp plants and sea urchins. They analyze the data collected by researchers, by graphing it on a TI calculator. Before graphing and analyzing the data, you may want to revisit the events of...
Curated OER
Match Me!
Young learners explore motion graphs in this instructional activity. They investigate distance-time plots as they move in a specific way in front of the CBR in an attempt to make a motion plot that matches a given plot. Pupils explore...
Curated OER
Shedding Light on the Weather with Relative Humidity
Learners study weather using a graphing calculator in this lesson. They collect data for temperature and relative humidity for every hour over a day from the newspaper, then place the data in their handheld calculator and examine it for...
Curated OER
The Effect of Acid Rain on Limestone
Pupils investigate the pH of rain water in this earth science lesson. They collect rain water from their area and explore the pH when lime stone is added, then they will use the data collected to conjecture as to the effect of acid rain...
Curated OER
Which Way?
Middle schoolers explore distance-time plots. In this algebra lesson, they will investigate how different types of motion affect the distance-time plot.
Curated OER
What's Your Speed?
Learners explore the concept of distance v. time. They use a CBR to collect data on their distance over time, then plot their data using a scatter plot and find an equation to model their data. Pupils discuss what if scenarios which...
Texas Instruments
Light and Day
Pupils explore the concept of collecting data as they collect data on their graphing calculator about time, temperature, and light. Learners plot the data and create histograms and box and whisker plots to analyze the data.
Curated OER
Slow Down - Speed Up
Pupils explore the concept of distance and time as they use a CBR to mimic distance v. time graphs. Learners walk towards and away from the monitor to create various distance v. time graphs, then discuss what motion creates certain graphs.
Curated OER
Classifying
In this classifying worksheet, students observe a group of words, analyze their similar characteristics and then give them a classification. Groups of words include items such as vegetables, reptiles, landforms, conifer trees,...
Beacon Learning Center
Beacon Learning Center: Interpreting Line Graphs
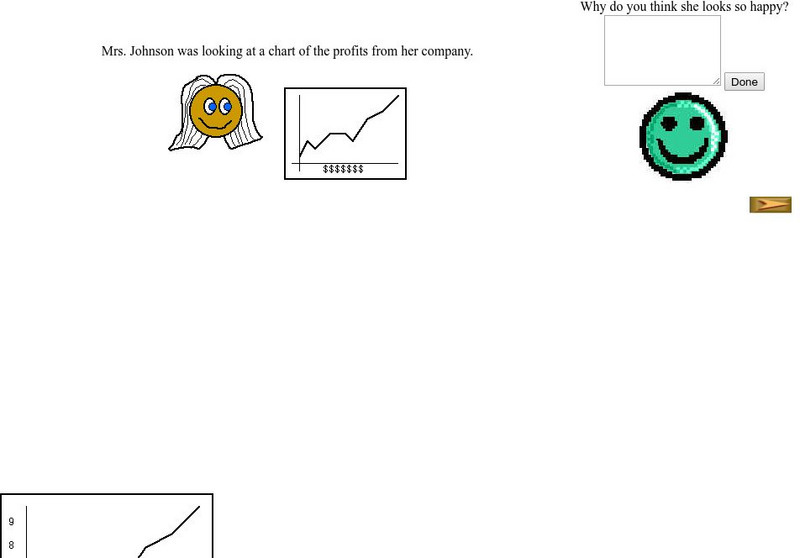
This site is a lesson on creating and interpreting a line graph. It explains how a line graph is created and then asks questions about what is learned from the data. Students type in open responses, and answers and feedback follow.
Beacon Learning Center
Beacon Learning Center: Piece of Pie
This is a tutorial for creating and practice interpreting pie charts. They use the example of number of people in each of 24 families to demonstrate how the pieces of pie are created. Then questions were asked and students input the...
Beacon Learning Center
Beacon Learning Center: Push Ups
This is a tutorial on line graphs including when, how, and why one might choose to use them and how to interpret the data when it is complete. This one is to reach a goal for the number of push ups needed to win the Presidential Fitness...
Other
Bucks County Community College: Visual Organizers
This site walks you through the benefits of visual organizers, and focuses on a variety of types: tables, charts, graphs, timelines, flowcharts, diagrams, and webs.
ReadWriteThink
Read Write Think: A Picture's Worth a Thousand Words: Image to Narrative
This lesson, which can be adapted to fit with any picture you choose, works for students of all levels.
Daily Teaching Tools
Daily Teaching Tools: Additional Webs
This Daily Teaching Tools resource provides a series of graphic organizers. Middle schoolers will be able to plan the writing of summaries, paragraphs, and literary responses.
Utah Education Network
Uen: Graphic Organizers Bring About Good Science Read/writing
This lesson uses graphic organizers to engage students in reading comprehension strategies for informational text in science. Venn Diagram, Hierarchy, Time Line, Cluster Diagram, and Flow Chart reproducible pages are included with the...
Read Works
Read Works: Passages: Predicting the Future
[Free Registration/Login Required] Students read an informational text about the predictions of a futurist and answer questions on comprehension, text support, main idea, vocabulary, and more. Links to a paired text and paired text...
Utah Education Network
Uen: Setting a Purpose for Reading Using Informational Text
This lesson engages students in using a two-column graphic organizer to take notes. Students will record titles and subtitles and list questions that will correspond with each one.
Utah Education Network
Uen: Using a Before Reading Organizer With Informational Text
This module provides strategies to use with informational text. Teachers will explicitly teach students about graphic organizers to use before reading informtational texts.
Sophia Learning
Sophia: Note Taking: Concept Maps and Flow Charts
This slideshow lesson focuses on note taking using concept maps and flow charts; it provides background information, 6 types of concept maps or flow charts with best uses, uses in the classroom, uses while reading or researching, and how...
Sophia Learning
Sophia: I Just Got Assigned a Paper, Now What?
This lesson focuses on what to do after being assigned a paper; it provides the basic steps to writing a paper: brainstorm topics, organize your thoughts (Venn diagrams, tree diagram examples), conduct preliminary research, create a...


