Hi, what do you want to do?
NASA
Nasa: Goddard Scientific Visualization Studio
This impressive exhibit of images and videos is available to see how NASA uses technology to track the weather. You can search by keyword for more specific images.
TeachEngineering
Teach Engineering: On Track Unit Conversion
Students use three tracks marked on the floor, one in yards, one in feet and one in inches. As they start and stop a robot specific distances on a "runway," they can easily determine the equivalent measurements in other units by looking...
Other
We Are Teachers: How to Do Goal Setting With Your Students This School Year
There's no shortage of teachers doing innovative work around goal setting for students. This article is a compilation of favorite resources. Included are books to read to your class, a goal planning worksheet, classroom activities,...
Other
Empowered Parents: 19 Kids' Activities & Games to Improve Hand Eye Coordination
Eye-hand coordination is an important gross motor skill children develop during the early years. Find out what it is, why it is important to develop and how you can help your children build their coordination with simple games and...
TeachEngineering
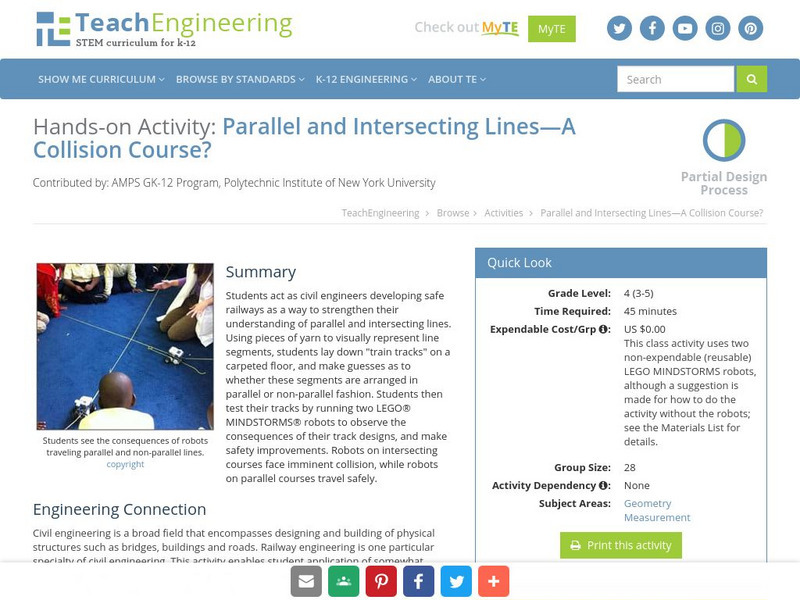
Teach Engineering: Parallel and Intersecting Lines: A Collision Course?
Students act as civil engineers developing safe railways as a way to strengthen their understanding of parallel and intersecting lines. Using pieces of yarn to visually represent line segments, students lay down "train tracks" on a...
Annenberg Foundation
Annenberg Learner: The Habitable Planet: Ecology Lab
Create the parameters of your own ecosystem by choosing which producers and consumers live there. Visualize how the food web operates and species populations change. This simulator mimics the food web within a typical ecosystem and gives...
University of Colorado
University of Colorado: Ph Et Interactive Simulations: Energy Forms and Changes
Explore how heating and cooling iron, brick, and water adds or removes energy. See how energy is transferred between objects. Build your own system, with energy sources, changers, and users. Track and visualize how energy flows and...
PBS
Pbs Learning Media: Arctic Ice Reaches 2015 Minimum Extent
NASA's Scientific Visualization Studio uses data from several sources to track seasonal changes in Arctic sea ice and land cover over time. Scientists study sea ice because it influences global climate. Watch the following visualization...
Other
Its Learning: Adapt 10 Common Offline Activities for a Blended Learning Classroom
A list of ten offline activities students can be assigned to complement online work for a blended classroom. These can ensure students are held accountable for the online tasks, and provide written, oral, or visual materials that can be...
Other
The u.s. Electoral College Calculator
Provides an overview of the electoral system and the process in which the president is elected. There is a visual calculator that lets you track election outcomes. Data for all U.S. elections is included.


