University of Colorado
University of Colorado: Ph Et Interactive Simulations: The Moving Man, Motion, Velocity, Acceleration, Position
Enhance study of motion, velocity, acceleration, position and graphing with this interactive simulation.
CK-12 Foundation
Ck 12: Physical Science: Velocity Time Graphs
[Free Registration/Login may be required to access all resource tools.] How to draw a velocity-time graph and what it represents.
Khan Academy
Khan Academy: What Are Velocity vs. Time Graphs?
Graphs and examples help explain what the vertical axis, slope, and area represent on a velocity-time graph.
Physics Classroom
The Physics Classroom: 1 D Kinematics: Kinematic Equations and Graphs
In this interactive physics tutorial, students investigate the relationships between two methods available to solve problems involving the numerical relationships between displacement, velocity, acceleration and time.
Science Education Resource Center at Carleton College
Serc: Student Analysis: Determine the Acceleration of a Toy Car
For this activity, learners measure the displacement and elapsed time of a moving toy car using a direct measurement video with an embedded frame counter. They then calculate average and final velocity, and the average acceleration, and...
Khan Academy
Khan Academy: What Are Acceleration vs. Time Graphs?
What can you learn from graphs that relate acceleration and time? This tutorial takes a look at the vertical axis, slope, and area on a graph and provides examples.
Khan Academy
Khan Academy: What Are Position vs. Time Graphs?
What can you learn from graphs that relate position and time and how are they useful? Article relates what the verticle axis, slope, and curvature represents on a position graph and provides examples.
Science Education Resource Center at Carleton College
Serc: Graphing 1 D Kinematic Motion
In this demonstration students are given a position, velocity, or acceleration graph showing the motion of an object. They describe the motion, and then make predictions by completing the remaining two graphs. Using a motion detector and...
Science Education Resource Center at Carleton College
Serc: Motion: Investigating Motion Graphs
For this lesson, students investigate motion graphs. Students predict what the distance-time graph and velocity time graph would look like for a student walking across the room for three different scenarios.
Science Education Resource Center at Carleton College
Serc: Graph Predictions for Position, Velocity and Acceleration
Students interactively create predictions of position, velocity, and acceleration graphs using java applets. The applets automatically classify student answers, so instructors can create graphs of student predictions.
Physics Classroom
The Physics Classroom: 1 D Kinematics: Meaning of Slope for a v T Graph
In this part of a physics lesson, examine how the actual slope value of any straight line on a velocity-time graph is the acceleration of the object.
Texas Education Agency
Texas Gateway: Speed, Velocity, and Acceleration
Given descriptions, illustrations, graphs, charts, or equations, students will differentiate between speed, velocity, and acceleration.
Physics Classroom
The Physics Classroom: 1 D Kinematics: Determining the Area on a v T Graph
In this interactive physics tutorial, students learn how a plot of velocity versus time can also be used to determine the displacement of an object.
Science Education Resource Center at Carleton College
Serc: Investigating Motion Graphing Speed
In this introduction to motion activity, students will get a personal understanding of speed and acceleration by experiencing it firsthand. Wheeled office chairs or other cart like devices are used to give one student a ride as a fellow...
CK-12 Foundation
Ck 12: Displacement During Constant Acceleration
[Free Registration/Login may be required to access all resource tools.] Students solve problems involving displacement, distance, velocity, speed, and acceleration, and then explore problems and graphs involving one-dimensional motion.
Khan Academy
Khan Academy: 2 D Projectile Motion: Identifying Graphs for Projectiles
Match graphs with the correct scenario for the projectile motion by understanding velocity, acceleration, and displacement.
Concord Consortium
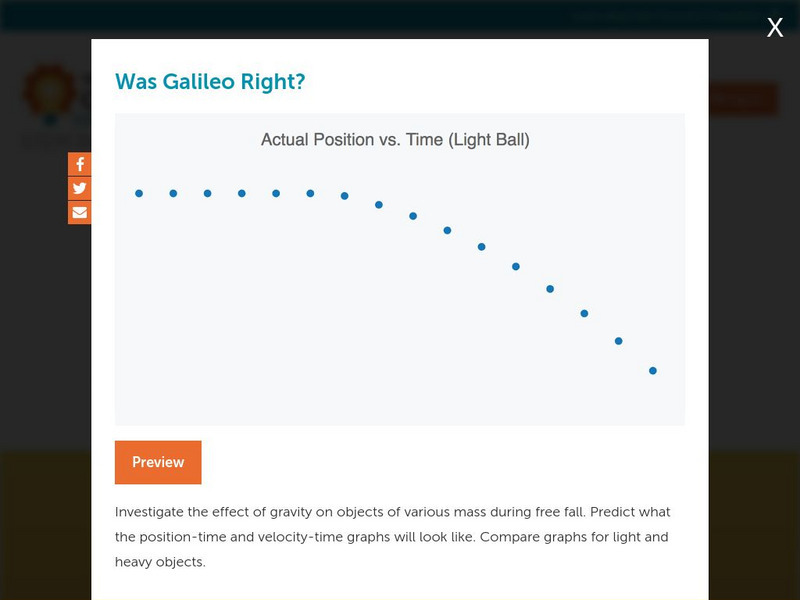
Concord Consortium: Was Galileo Right?
Investigate the effect of gravity on objects of various mass during free fall. Predict what the position-time and velocity-time graphs will look like. Compare graphs for light and heavy objects.
CK-12 Foundation
Ck 12 Exploration Series: Simulations: Physics: Archery
[Free Registration/Login Required] Watch this animation as an archer shoots at a target on an angle, and its horizontal and vertical paths and its velocity are explained. An interactive follows where you can manipulate the archer's...
CK-12 Foundation
Ck 12: Physics: Uniform Acceleration
[Free Registration/Login may be required to access all resource tools.] Provides a definition for uniform acceleration and the formulas relating initial velocity, final velocity, time, and acceleration. Includes interactive simulation.
Khan Academy
Khan Academy: What Are Velocity vs. Time Graphs?
How to analyze graphs that relate velocity and time to acceleration and displacement.
Khan Academy
Khan Academy: Calculating Average Acceleration From Graphs
Practice calculating acceleration from velocity vs. time graphs
Texas Instruments
Texas Instruments: Making Motion Graphs With Toys
Intended for the beginning lessons in derivative and function graphs, this activity uses motion detectors and battery operated toy cars to generate constant velocity graphs on a TI-83/84. Then students take a free-wheeling car and roll...
Other
Institute of Physics: Practical Physics: Speed Time Graphs to Find an Equation
An illustrated example of a speed-time graph plotted with speed on the vertical axis against time on the horizontal axis.
Physics Aviary
Physics Aviary: Graphing Motion Problem Level 5
Find out the acceleration of an object from a position vs. time graph by finding the instantaneous velocity at two different points.

