Other
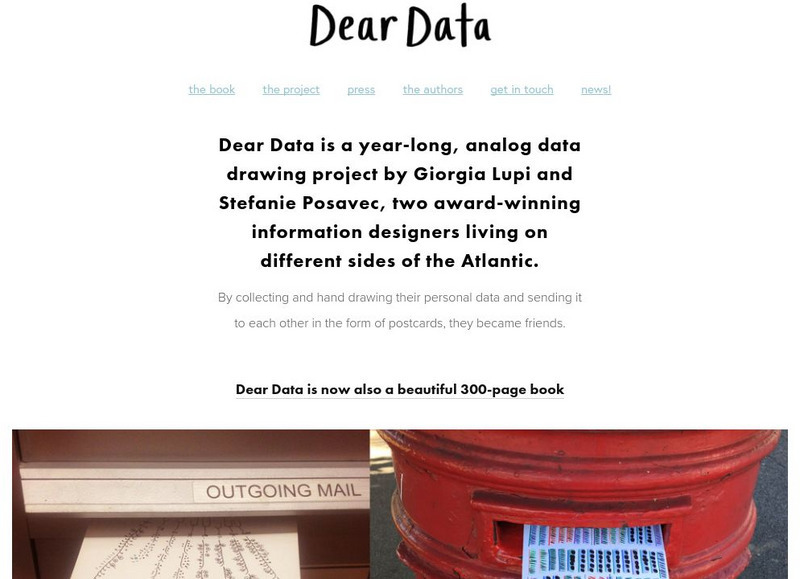
Dear Data
Dear Data is a year-long, analog data drawing project by Giorgia Lupi and Stefanie Posavec, two award-winning information designers living on different sides of the Atlantic. By collecting and hand drawing their personal data and sending...
PBS
Pbs Kids Afterschool Adventure!: Operation: Data Saves the Day Activity Plan
Data comes to the rescue! Children will collect, analyze, and represent data as they try to dodge a series of catastrophes faced by characters from their favorite PBS Kids shows.
National Council of Teachers of Mathematics
The Math Forum: Exploring Ocean Data Lesson Plan
Find "oceans of data" for students of all ages. NCTM, California, and Philadelphia standards are listed for each grade level along with lesson plans and other website resources.
Government of Alberta
Learn Alberta: Math Interactives: Exploring Data Display and Graphs
This multimedia Learn Alberta math resource focuses on graphing data. In the video portion, students will see how math is involved in the display of merchandise in stores. The accompanying interactive component provides an exploration...
Stanford University
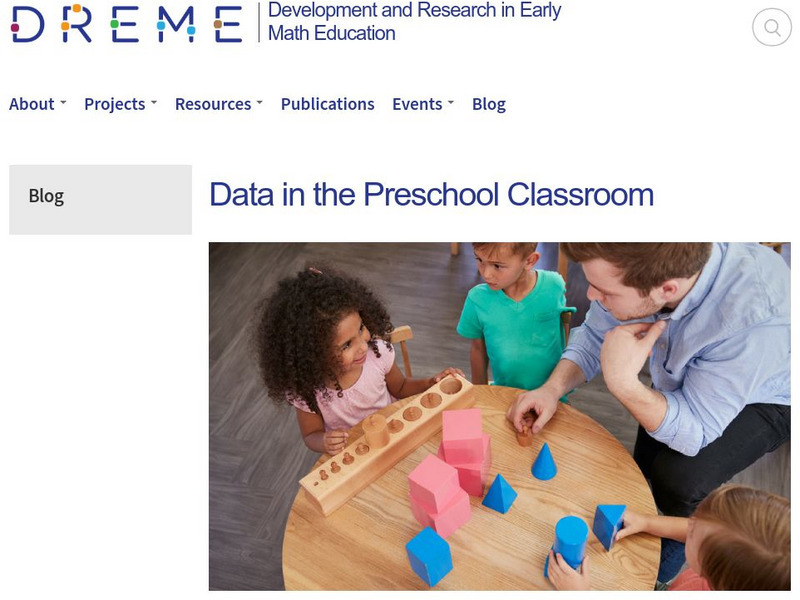
Dreme: Data in the Preschool Classroom
What are the important concepts involved in data collection and data use in the preschool classroom, and how can teachers support the mathematics of data? This article gives a brief description of the concepts that children need to grasp...
Scholastic
Scholastic: Study Jams! Math: Data Analysis: Line Plots
Explore how to organize and plot data on a line plot by going step by step through the activity. Then test your knowledge to check for understanding.
CK-12 Foundation
Ck 12: Matrices to Represent Data
[Free Registration/Login may be required to access all resource tools.] A collection of resources to help students understand how to use matrices to represent and manipulate data, e.g., to represent payoffs or incidence relationships in...
Mangahigh
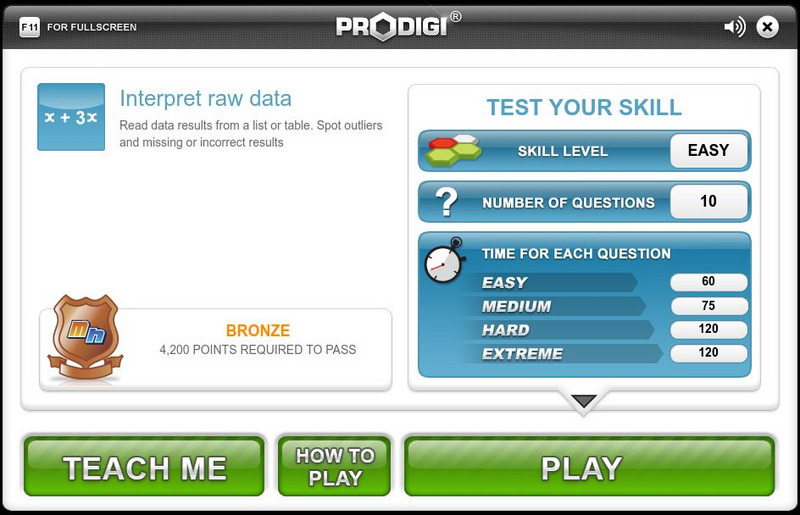
Mangahigh: Data: Interpret Raw Data
Students learn about the concept of interpreting raw data and finding outliers by exploring a tutorial. They can then test their knowledge by taking a ten question assessment that increases in difficulty as they correctly answer questions.
Scholastic
Scholastic: Data Sampling
Data Sampling is a cutting-edge digital program designed to give learners multiple opportunities to dig deeply into the mathematics and real-world purposes of representative sampling.
Science Buddies
Science Buddies: Rock On! Recording Digital Data With Magnets
This is a straightforward project that shows you how data can be digitized and stored on magnetic recording media. You'll learn how alpha-numeric characters are digitized, and you'll use bar magnets to represent the individual data...
Khan Academy
Khan Academy: Read Line Plots (Data With Fractions)
Practice reading and interpreting data that is graphed on line plots. The data graphed includes fractions. Students receive immediate feedback and have the opportunity to try questions repeatedly, watch a video or receive hints....
University of Texas
Inside Mathematics: Granny's Balloon Trip [Pdf]
This task challenges a student to use knowledge of scale to organize and represent data from a table on a graph.
BBC
Bbc: Representing Data
This BBC Math Bite tutorial for line graphs, pictograms, and frequency polygons features an exam in which students draw and interpret statistical diagrams.
National Council of Teachers of Mathematics
Nctm: Illuminations: Canada Data Map
Information can be represented in many ways, and this application allows the user to represent data about the provinces and territories using colors.
Better Lesson
Better Lesson: Understanding Data!
Fourth graders will gear up to explore how to find the means, median, and modes to represent data.
Illustrative Mathematics
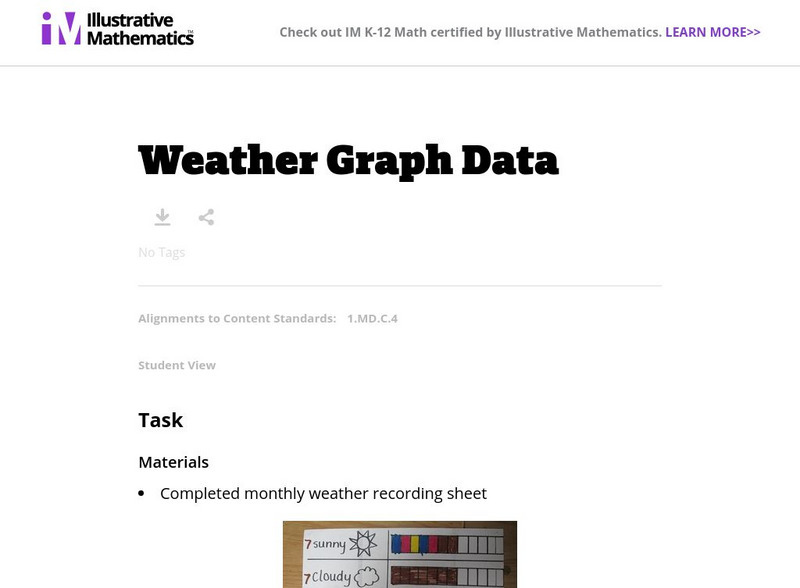
Illustrative Mathematics: Weather Graph Data
The purpose of this task is for students to represent and interpret weather data, as well as answer questions about the data they have recorded. Student worksheets and recording sheet are included.
National Council of Teachers of Mathematics
Nctm: Illuminations: State Data Map
Data can be displayed in a variety of ways. This interactive map of the United States shows data by degrees of color. Choose to display data such as: land area, population, population density, gas use, and much more.
Sophia Learning
Sophia: Representing Data With Box and Whisker Plots
This lesson demonstrates how a box-and-whisker plot can be used to represent data.
CK-12 Foundation
Ck 12: Introduction to Matrices: Matrices to Represent Data
[Free Registration/Login may be required to access all resource tools.] This lesson defines, organizes, and compares matrices. Includes examples, video, and review problems.
Khan Academy
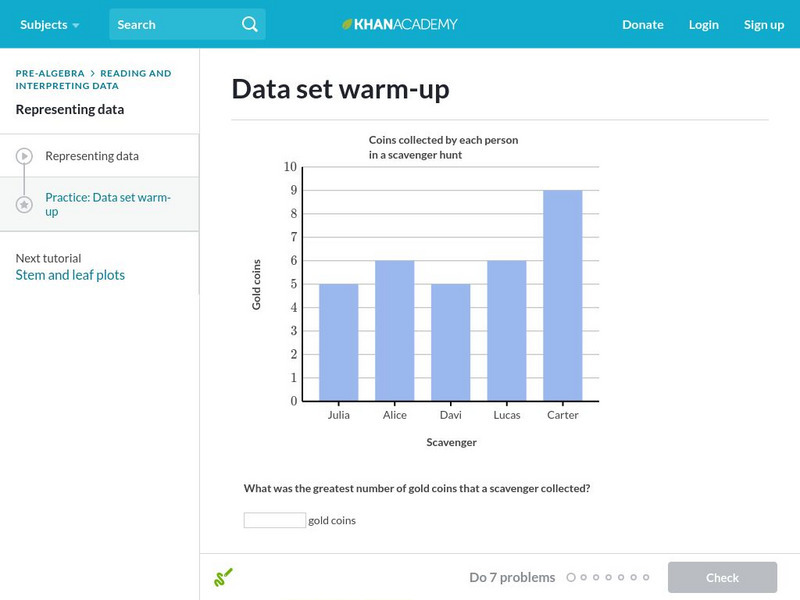
Khan Academy: Data Set Warm Up
Begin your journey into the world of statistics with some warm-up questions about data sets. Students receive immediate feedback and have the opportunity to try questions repeatedly, watch a video or receive hints.
Education.com
Education.com: 1.md.c.4 Worksheets
[Free Registration/Login Required] These worksheets can help students practice organizing, representing, and interpreting data with up to three categories. Choose from among 25 worksheets based on your student's needs.
CK-12 Foundation
Ck 12: Algebra: Fitting Lines to Data
[Free Registration/Login may be required to access all resource tools.] Make a scatter plot of data and find the line of best fit to represent that data.
McGraw Hill
Glencoe: Using Graphs to Understand Data Quiz
This is a quiz with five quick questions to check your knowledge of how to use graphs to understand data. It is self-checking.
