Hi, what do you want to do?
National Geographic
National Geographic: Population Density in the United States
Several factors contribute to the population trends across the United States. This lesson will explore maps to discover and understand these trends.
Curated OER
U. Of Texas: Sri Lanka: Ethnic Communities; Population Density; Land Use
Three great maps of Sri Lanka on one page. You can see the ethnic groups and religions on one map, the population density of the country on another, and the land use and economic activity on the third. From the Perry-Castaneda Collection
Association of Religion Data Archives
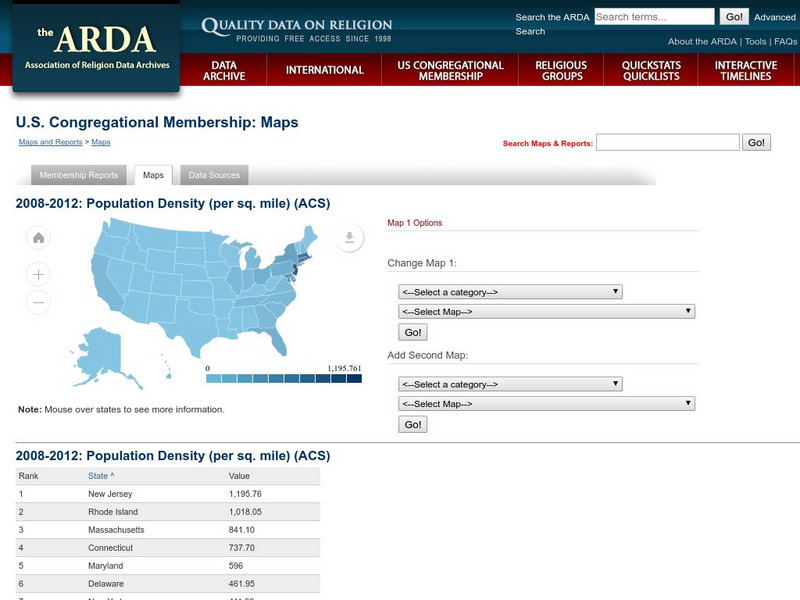
Association of Religion Data Archives: u.s. Population Density Map
Interactive tool that lets you choose a map (Census or Religion), then choose demographic or religious profiles to create a slideshow.
National Council of Teachers of Mathematics
Nctm: Illuminations: State Data Map
Data can be displayed in a variety of ways. This interactive map of the United States shows data by degrees of color. Choose to display data such as: land area, population, population density, gas use, and much more.
Geographypods
Geographypods: Theme 1: Population and Settlement
A rich collection of highly engaging learning modules on topics related to population and settlement. Covers six main areas - population growth, population change, population migration, land use, settlement characteristics and patterns,...
University of Richmond
Digital Scholarship Lab: Voting America: White Population Density, 1840 2000
This map shows population change among whites in US counties, 1840 to 2000. Each dot represents 500 people. Corresponding historical events and elections are included for each period of time.
University of Richmond
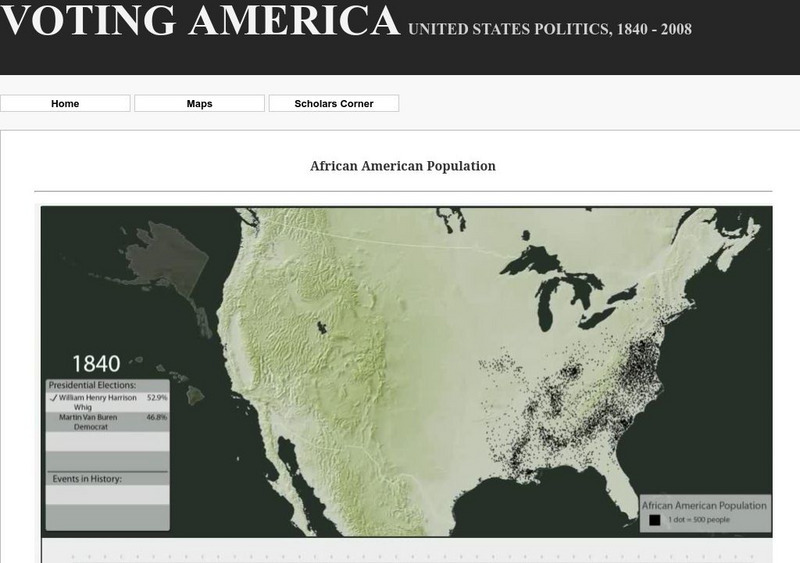
Digital Scholarship Lab: African American Population Density, 1840 2000
This interactive map shows the African-American population change in U.S. counties from 1840 to 2000. Each dot represents 500 people. Corresponding historical events are included for each period of time.
Other
Just Maps: World Maps
An index of maps and flags of countries throughout the world. Also provides political maps, time zones, population, and religious maps of every region of the world.
Curated OER
Map/still:population Density of Spain.
A map showing the population density of Spain from the online edition of Encyclopedia Britannica.
Curated OER
Etc: Maps Etc: Population Density of South America, 1911
A map from 1911 of South America showing the population density across the region. The map is color-coded to show areas of population densities ranging from under 2 persons per square mile to over 256 persons per square mile. A chart at...
Curated OER
Etc: Maps Etc: United States Population Density, 1900
A map from 1912 of the United States, subtitled "Distribution of Population and Railways in 1900" showing the increase in population and expansion of the railroad network since 1850. The map is color-coded to show population densities...
Curated OER
Educational Technology Clearinghouse: Maps Etc: Population Density of Asia, 1910
A map from 1910 showing the political boundaries and the distribution of population density of Asia at the time. This map uses gradated shading to shows areas of population densities ranging from under 2 inhabitants per square mile to...
Curated OER
Etc: Maps Etc: North American Population Density, 1910
A map from 1910 of North America, Central America, Greenland and the Caribbean showing population density distribution in the region at the time. The map is coded to show areas of population densities ranging from less than 1 inhabitant...
Curated OER
Etc: Maps Etc: Population Density of South America, 1910
A map showing the population density of South America around 1910. The map shows the regions where population density ranges from under two inhabitants per square mile to regions of population over 512 inhabitants per square mile. Cities...
Curated OER
Etc: Maps Etc: United States Population Density, 1850
A map from 1912 of the United States, subtitled "Distribution of Population and Railways in 1850." The map is color-coded to show population densities ranging from areas with fewer than 2 inhabitants per square mile to areas of 90 or...
Curated OER
Etc: Maps Etc: Population Density From the First Census, 1790
A map of the eastern United States in 1790 showing the western extent of the territories to the Mississippi, and the distribution of European-American population at the time. The map is keyed to show areas of population densities ranging...
Curated OER
Etc: Maps Etc: Population Density in Africa, 1916
A map showing the population density of Africa in 1916 showing density ranges from under 2 inhabitants to areas along the Nile River valley and delta of more than 512 inhabitants per square mile.
Curated OER
Educational Technology Clearinghouse: Maps Etc: Population Density in Asia, 1916
A map from 1916 of Asia showing the population density of the region at the time.
Northern Illinois University
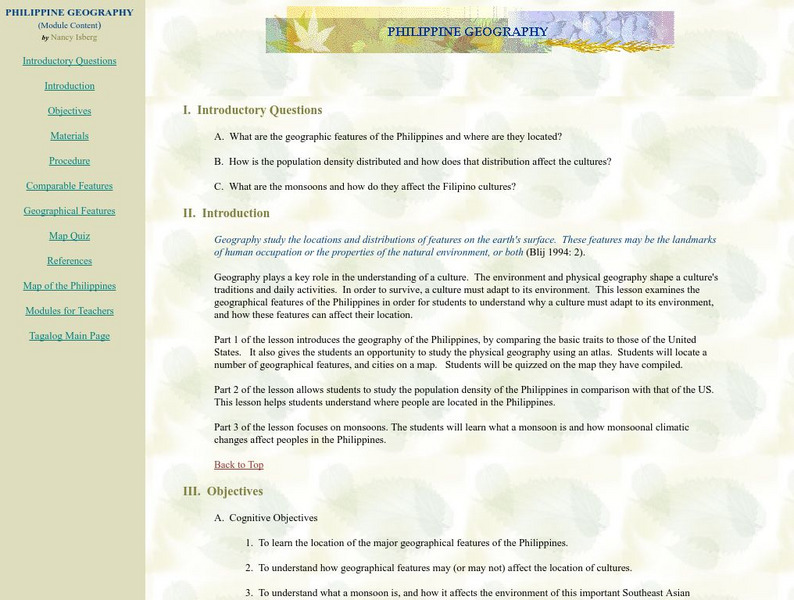
Tagalog: Philippine Geography
This website gives a great lesson plan for helping to understand the geography and physical environment of the Philippines. Map and map quiz are included.
Biblioteca Virtual Miguel de Cervantes
Biblioteca Virtual Miguel De Cervantes: Paraguay
This resource site in Spanish for the country of Paraguay. The flag and a general map of the country are included. Of particular interest is the statistical data available on land size, climate, population, life expectancy, infant...
Biblioteca Virtual Miguel de Cervantes
Biblioteca Virtual Miguel De Cervantes: El Salvador
This resource site in Spanish for the country of El Salvador. The flag and a general map of the country are included. Of particular interest is the statistical data available on land size, climate, population, life expectancy, infant...
Biblioteca Virtual Miguel de Cervantes
Biblioteca Virtual Miguel De Cervantes: Costa Rica
This resource site in Spanish for the country of Costa Rica. The flag and a general map of the country are included. Of particular interest is the statistical data available on land size, climate, population, life expectancy, infant...
Biblioteca Virtual Miguel de Cervantes
Biblioteca Virtual Miguel De Cervantes: Colombia
This resource is on the country of Colombia. The flag and a general map of the country are included. Of particular interest is the statistical data available on land size, climate, population, life expectancy, infant mortality rate, and...
BSCS Science Learning
Bscs: Global Night Sky Comparison
This inquiry invites students to investigate human impacts on the environment. Specifically, students will examine the relationship between human population, light pollution, and how brightly celestial objects like stars appear in the...


