Texas Instruments
Texas Instruments: M&m's and Exponential Graphs
Students can use M&M's to model a decay equation - exponential equations.
Science Education Resource Center at Carleton College
Serc: Radioactive Dating: Looking at Half Lives Using M&ms
In this activity, students gain a better understanding of radioactive dating and half-lives by using M&Ms to demonstrate the idea of radioactive decay. They will be able to see how scientists can determine the age of rocks by looking...
Alabama Learning Exchange
Alex: M&m's and Blogs: Interpreting Data!
In this hands-on, technology-rich lesson plan, students will interpret data. The students will define words involving graphs, create a bar graph using M&M's, and post information from their findings on the internet. The students will...
Better Lesson
Better Lesson: Graphing With M&m's
M&M's can be used to create a unique data set and can be graphed by students
University of South Florida
Fcat: Bungee M&m's: Teacher Notes
Students will learn how to draw a line of best fit for a set of data using m&m's and a "Bungee."
American Chemical Society
Inquiry in Action: Mysterious M&m's
Students will ask questions and learn more about dissolving in this activity where they place M&M in water. Activity includes students activity sheet and teacher instructions.
Texas Instruments
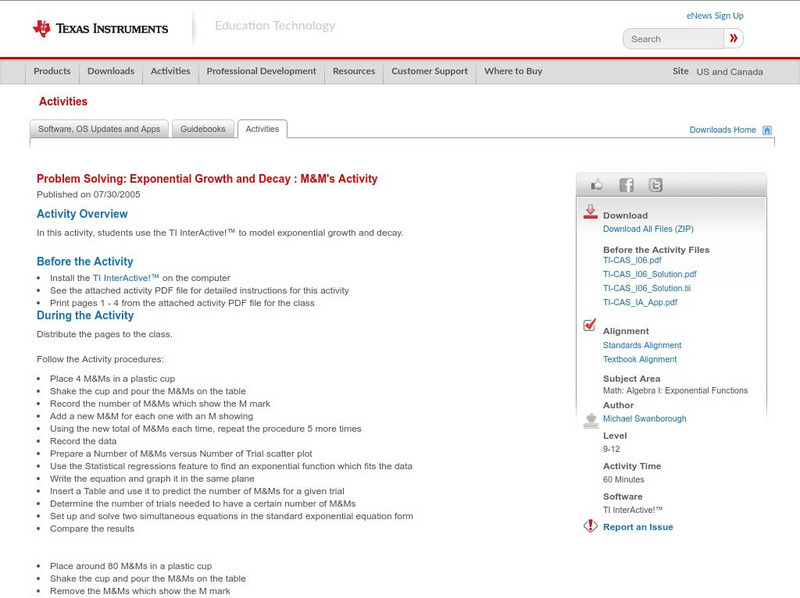
Texas Instruments: Exponential Growth and Decay : M&m's Activity
In this activity, students use the TI InterActive! to model exponential growth and decay.
Texas Instruments
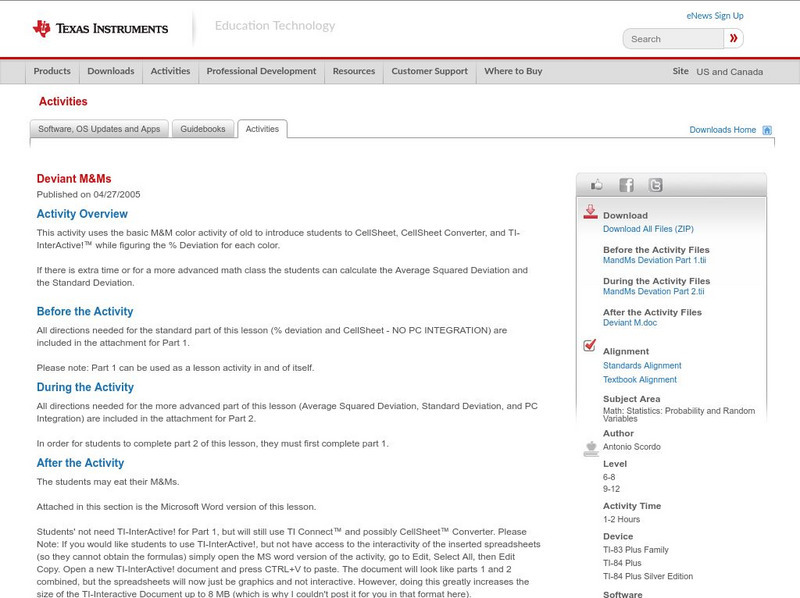
Texas Instruments: Deviant M&ms
This activity uses the basic M&M color activity of old to introduce students to CellSheet, CellSheet Converter, and TI-InterActive! while figuring the % Deviation for each color. If there is extra time or for a more advanced math...
Texas Instruments
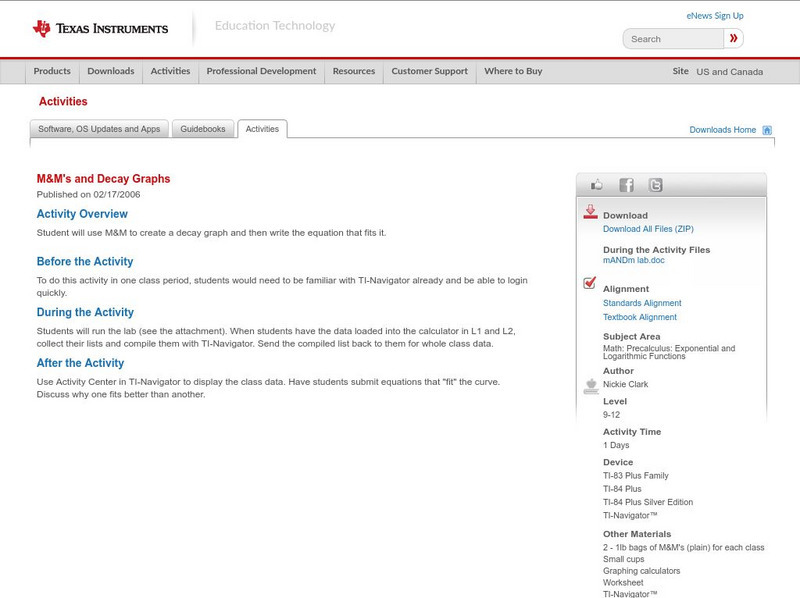
Texas Instruments: M&m's and Decay Graphs
Observe exponential decay with the classic M&M lab, here written up and ready to go. At the end, the author intends for students to send equations and data to the teacher via TI-Navigator, but this step can done on paper if the...
Science Education Resource Center at Carleton College
Serc: Investigating Isotopes: Using M&m's as a Model for Calculating Atomic Mass
This activity allows students to gain an understanding of the relationship between the mass and relative abundance of an isotope and its effect on the average atomic mass of the element. Students will be given a random sample of the...
Cyberbee
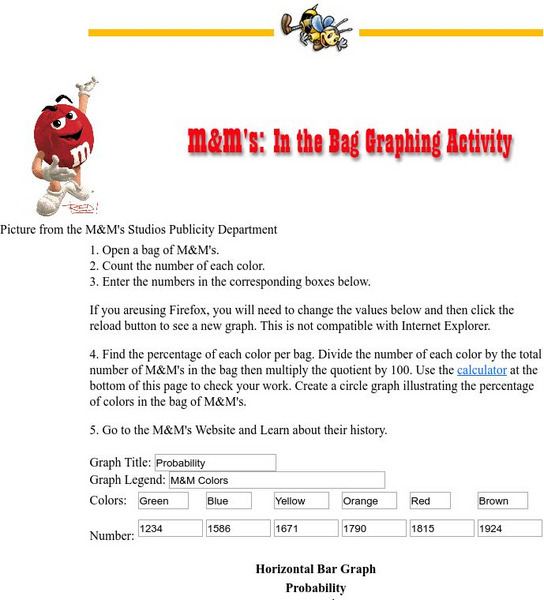
Cyberbee: M&ms in the Bag Graphing Activity
Use a bag of M&Ms to learn about probability. Includes graphs and percentages, and the steps needed for the students to duplicate the numbers.
American Chemical Society
Inquiry in Action: M&m's in Different Sugar Solutions
An activity to investigate the factors that affect the rate of a substance dissolving. In this activity, students see if the rate of dissolving of the M&M coat is changed by the amount of sugar already dissolved in water. This...
American Chemical Society
Inquiry in Action: Colors Collide or Combine
Do M&Ms colors combine or collide when they are put together on a plate of water? This lab activity will have students investigating what happens when M&Ms get wet.
American Chemical Society
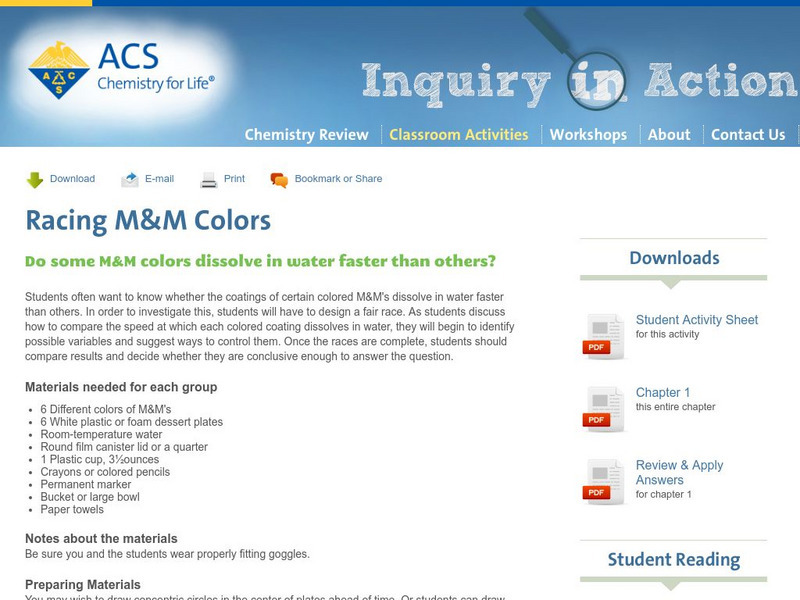
Inquiry in Action: Racing M&m Colors
An activity where students can experiment with whether different colors of M&Ms dissolve faster in water versus others. This lab includes a student worksheet and teacher instructions.
University of South Florida
Fcat: Get a Half Life!: Teacher Notes
Learners use M&M's and a graphing calculator to collect and graph data. This activity helps them to understand exponential functions and the concept of half-life.
Science Buddies
Science Buddies: M&m Math
By using a simple bag of M&Ms, you can conduct an experiment in statistics to determine the frequency of colors in the package. The Science Buddies project ideas are set up consistently beginning with an abstract, objective, and...
TeachEngineering
Teach Engineering: A Recipe for Air
Students use M&M's to create a pie graph that expresses their understanding of the composition of air. The students discuss why knowing this information is important to engineers.
Better Lesson
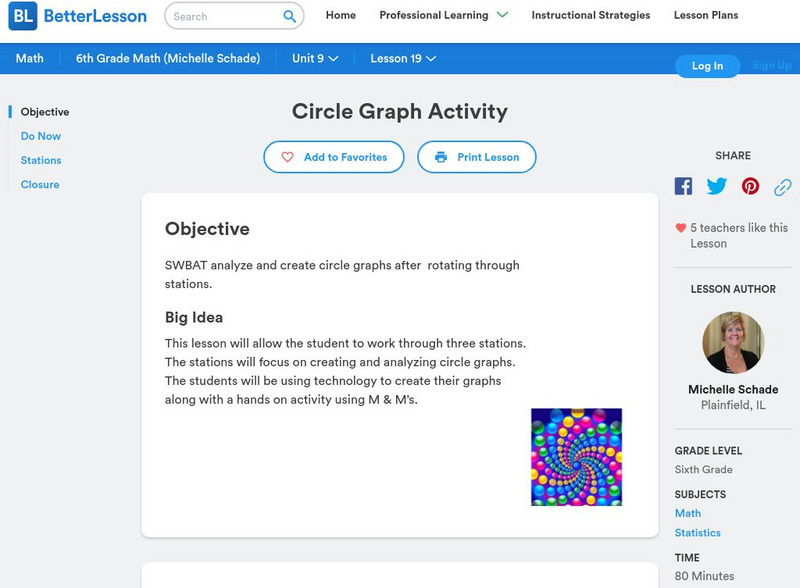
Better Lesson: Circle Graph Activity
This lesson will allow the student to work through three stations. The stations will focus on creating and analyzing circle graphs. The students will be using technology to create their graphs along with a hands-on activity using M&M's.
Other
Delta State University: Lesson Plan 3: Pie Graphs
The students will gather, organize, and display data in an appropriate pie (circle) graph using M&M's! [PDF]
American Chemical Society
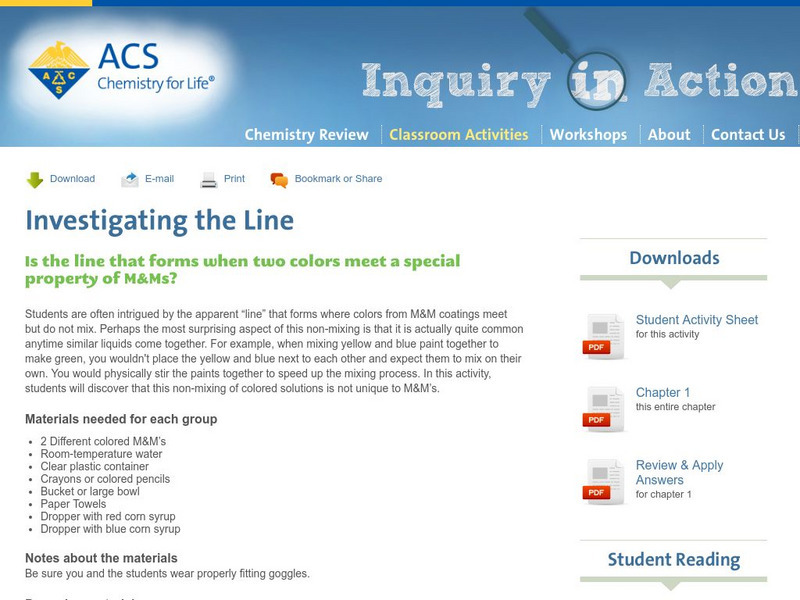
Inquiry in Action: Investigating the Line
Students will observe the non-mixing of colored solutions by using M&M's in this lab activity. Lab activity includes both student and teacher instruction sheets.
American Chemical Society
Inquiry in Action: M&m in Different Temperatures
An activity where students experiment with the effect of temperature on how fast the colored coating dissolves on M&M's. Activity includes student and teacher instructions.
Science Buddies
Science Buddies: Do Preferences Bias Our Choices?
In this science project you will test whether color preference will affect repetitive tasks that require fine motor coordination, like picking up small objects very quickly. Find out if your color preferences will bias these repetitive...
Science is Fun
Fun Science: Candy Chromatography
Using simple household items like M&Ms and coffee filters, you can demonstrate paper chromatography. This simple lab will show you the dyes that make up the different color coatings on M&Ms.
Texas Instruments
Texas Instruments: Why Aren't There More Reds in My Bag?
Students use small bags of M&M's to make predictions, gather data, and display color distribution results in a circle graph. They explore the concept of ratios and sample size.


