Hi, what do you want to do?
ArtsNow
Arts Now Learning: We Are Living Graphs and Data [Pdf]
In this lesson plan, 3rd graders use their own bodies to create bar graphs and do problems involving addition, subtraction, and more or less amounts. They then create their own graphs, incorporating the features of graphs that they have...
Scholastic
Scholastic: Cultivating Data
Students will understand key concepts of data analysis and their graphic representations. Students will construct and interpret data tables, line plots, box-and-whisker plots and stem-and-leaf plots, scatterplots with line of best fit,...
E-learning for Kids
E Learning for Kids: Math: Traditional African Village: Bar Graph and Data
Help Kyan make a bar graph with the ages of the children in his village.
Louisiana Department of Education
Louisiana Doe: Louisiana Believes: Eureka Math Parent Guide: Problem Solving With Length, Money, and Data
A guide to support parents as they work with their students with problem solving with length, money, and data.
NASA
Nasa: Precipitation Towers: Modeling Weather Data
This lesson uses stacking cubes as a way to graph precipitation data, comparing the precipitation averages and seasonal patterns for several locations. Variations on the lesson can accommodate various ages and ability levels. Students...
Vision Learning
Visionlearning: Data: Using Graphs and Visual Data in Science
An explanation of how data can be turned into visual forms which can help people comprehend information easier than observing numbers.
PBS
Pbs Kids Afterschool Adventure!: Operation: Data Saves the Day Activity Plan
Data comes to the rescue! Children will collect, analyze, and represent data as they try to dodge a series of catastrophes faced by characters from their favorite PBS Kids shows.
NASA
Nasa: Using Radiosonde Data From a Weather Balloon Launch
This lesson plan allows students to learn about the layers of the atmosphere and to learn how to graph real atmospheric data.
Other
Bscs: Asking and Answering Questions With Data
In this self-directed lesson, students use graphs and maps of water quality to investigate relationships between variables to answer questions. A handout with everything the student needs to complete this lesson is available as a PDF or...
Khan Academy
Khan Academy: Read Line Plots (Data With Fractions)
Practice reading and interpreting data that is graphed on line plots. The data graphed includes fractions. Students receive immediate feedback and have the opportunity to try questions repeatedly, watch a video or receive hints....
Government of Alberta
Learn Alberta: Math Interactives: Exploring Data Display and Graphs
This multimedia Learn Alberta math resource focuses on graphing data. In the video portion, students will see how math is involved in the display of merchandise in stores. The accompanying interactive component provides an exploration...
Sophia Learning
Sophia: Using Graphs to Analyze Data
This lesson will demonstrate how to analyze and interpret data given in the form of a graph.
NOAA
Noaa: Estuaries: Noaa: Science Data: Graphing
Create graphs of marine ecosystems using real-time data.
Center for Innovation in Engineering and Science Education, Stevens Institute of Technology
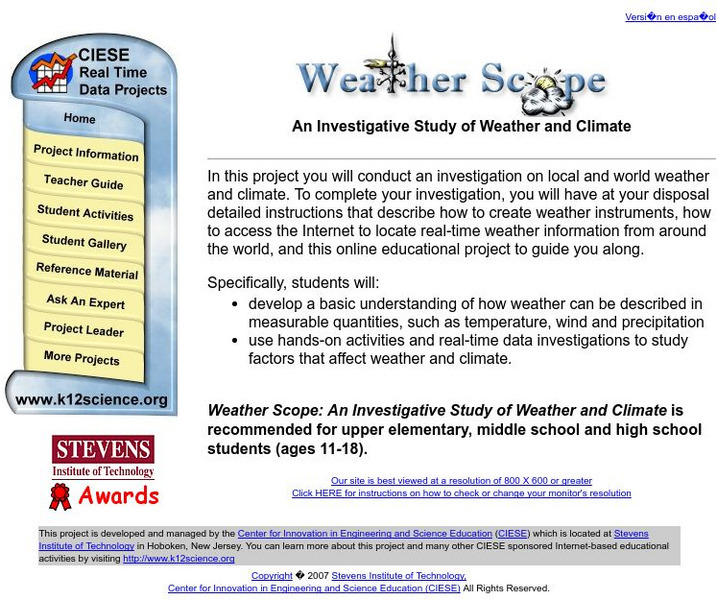
Ciese Real Time Data Projects: Weather Scope: A Study of Weather and Climate
Use real-time data to study factors that affect weather and climate, create weather instruments, and share data with students around the world.
Texas Education Agency
Texas Gateway: Selecting and Using Representations for Collected Data
[Accessible by TX Educators. Free Registration/Login Required] Given a variety of data (including line plots, line graphs, stem and leaf plots, circle graphs, bar graphs, box and whisker plots, histograms, and Venn diagrams), the student...
Texas Education Agency
Texas Gateway: Scientific Investigation and Reasoning Data Organization
Using interactive exercises, students will review how to construct tables and graphs in order to organize data.
Better Lesson
Better Lesson: Jumping Into Math, Measurement, & Data Day 1
Third graders apply measurement, graphing, and data skills to the real world context of physical education with standing jumps.
Government of Alberta
Learn Alberta: Math Interactives: Exploring Election Data
Using actual Alberta provincial election results, students have the opportunity to interpret election data using a variety of graph types. Pictographs, line graphs, bar graphs, circle graphs, and data tables are covered in this...
National Center for Ecological Analysis and Synthesis, University of California Santa Barbara
Kids Do Ecology: Data and Science
Learn about conducting your own investigation with these tips on following the scientific method. Find out how to state hypothesis, make observations, collect and analyze data, and display data to share results and conclusions of your...
National Council of Teachers of Mathematics
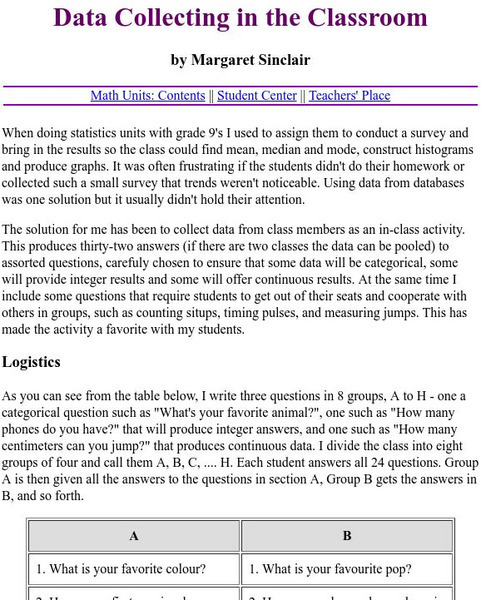
The Math Forum: Data Collecting in the Classroom
A list of two dozen questions students can easily ask eachother in the classroom to quickly collect data in hopes of using it in their study of making graphs. Some are opinion questions, while others require the counting of certain items...
E-learning for Kids
E Learning for Kids: Math: Carnival Parade in Rio: Chance & Data
Help Louis during the Carnival with graphs and chances.
Science Education Resource Center at Carleton College
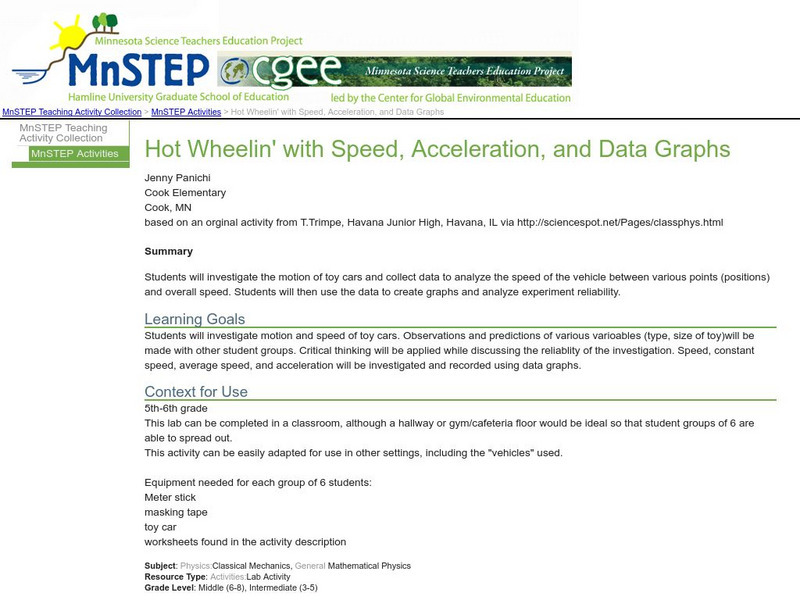
Serc: Hot Wheelin' With Speed, Acceleration, and Data Graphs
In this lab, students investigate the motion of toy cars and collect data to analyze the speed of the vehicle between various points and overall speed.
Cuemath
Cuemath: Data Handling
This comprehensive guide about data handling helps with understanding how the study of data handling and graphical representation of the data along with other tools help us in dealing with numerical data. Includes solved examples and...
Texas Education Agency
Texas Gateway: Evaluating Data in Tables, Graphs and Charts
[Accessible by TX Educators. Free Registration/Login Required] In this lesson students look at examples of graphics, tables, charts, and graphs, and learn how to interpret their data. They will be able to use this skill to enhance their...
Other popular searches
- Data Analysis and Graphs
- Data and Graphs
- Data Collection and Graphs
- Analyzing Data and Graphs
- Data Sets and Graphs
- Graphs and Data Display
- Graphs and Data Tables
- Analyze Data and Graphs
- Collect Data and Graphs
- Graphs and Data Handling
- Science Data and Graphs
- Data Displays and Graphs


![Arts Now Learning: We Are Living Graphs and Data [Pdf] Lesson Plan Arts Now Learning: We Are Living Graphs and Data [Pdf] Lesson Plan](https://static.lp.lexp.cloud/images/attachment_defaults/resource/large/FPO-knovation.png)


