Hi, what do you want to do?
NOAA
Noaa: Estuaries: Noaa: Science Data: Graphing
Create graphs of marine ecosystems using real-time data.
Vision Learning
Visionlearning: Data: Using Graphs and Visual Data in Science
An explanation of how data can be turned into visual forms which can help people comprehend information easier than observing numbers.
Science Buddies
Science Buddies: Interpreting Area Data From Maps vs. Graphs
Graphical methods of data presentation are a key feature of scientific communication. This project asks the question, "What's the best way to compare the land area of states: a map or a bar graph?" You'll be measuring performance on two...
Science Buddies
Science Buddies: Scientific Method Data Analysis/graphs
At the end of your experiment you should review all of the data you have collected. See samples of data analysis charts and graphs. Find out what makes for a good chart or graph using the self-grading rubrics.
BSCS Science Learning
Bscs: Invitations to Inquiry With Data Using Field Scope
Invitations to Inquiry are short instructional activities designed to help middle and high school students work with large data sets. Teachers and students use the interactive FieldScope platform to collect, visualize, and analyze...
American Association of Physics Teachers
Com Padre Digital Library: Open Source Physics: Data Tool Program
Use this online data analysis tool to build graphs and display results from scientific investigations. Data can be entered directly with the keyboard or imported from, and exported to spreadsheets.
National Center for Ecological Analysis and Synthesis, University of California Santa Barbara
Kids Do Ecology: Data and Science
Learn about conducting your own investigation with these tips on following the scientific method. Find out how to state hypothesis, make observations, collect and analyze data, and display data to share results and conclusions of your...
Science Buddies
Science Buddies: An Experiment in Visual Perception
Graphical methods of data presentation are a key feature of scientific communication. This project will get you thinking about how to find the best way to communicate scientific information.
Khan Academy
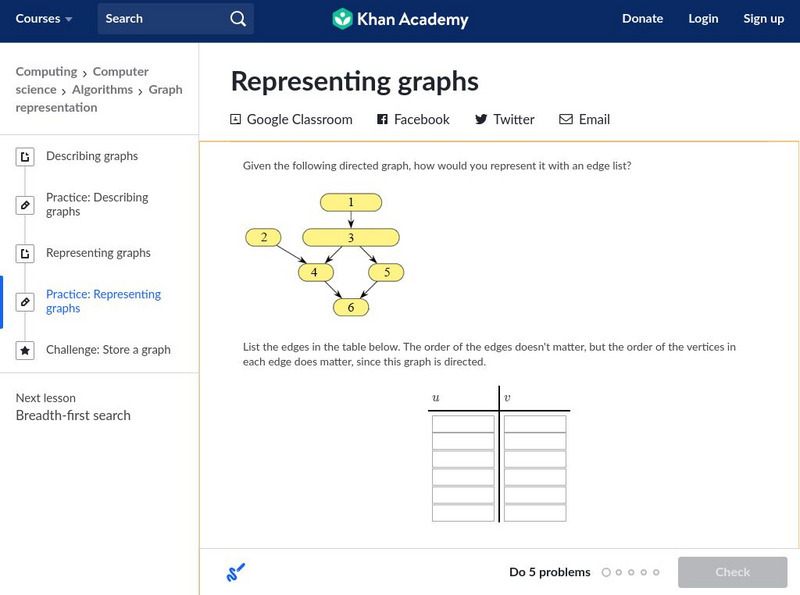
Khan Academy: Representing Graphs
Some practice problems with data and graph representation in computer science.
Other
Water on the Web
Water on the Web (WOW) is an advanced site allowing students to actively participate in data analysis from real research sites. Lesson plans on a range of topics are provided. There is also a tutorial for using Excel to graph WOW data.
Science Buddies
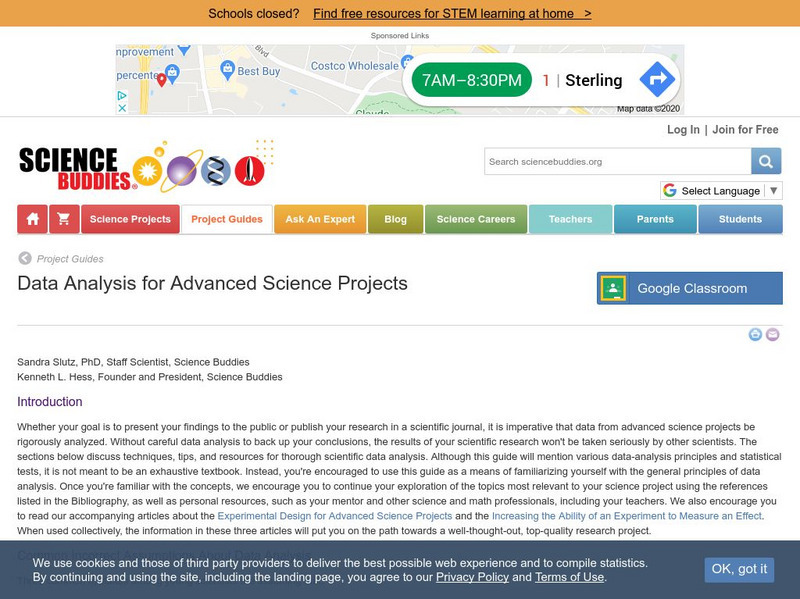
Science Buddies: Data Analysis for Advanced Science Projects
The importance of data analysis in science projects is explained. Describes common mistakes young scientists make. The article then discusses how to find out what the standard methods of data analysis are for the type of research you...
Khan Academy
Khan Academy: The Sources of Big Data
Sources of big data and the issues of storage are examined.
Discovery Education
Discovery Education: Science Fair Central: Investigation Set Up and Collect Data
A brief overview of how to gather both quantitative and qualitative data, complete with a sample data table.
Science Education Resource Center at Carleton College
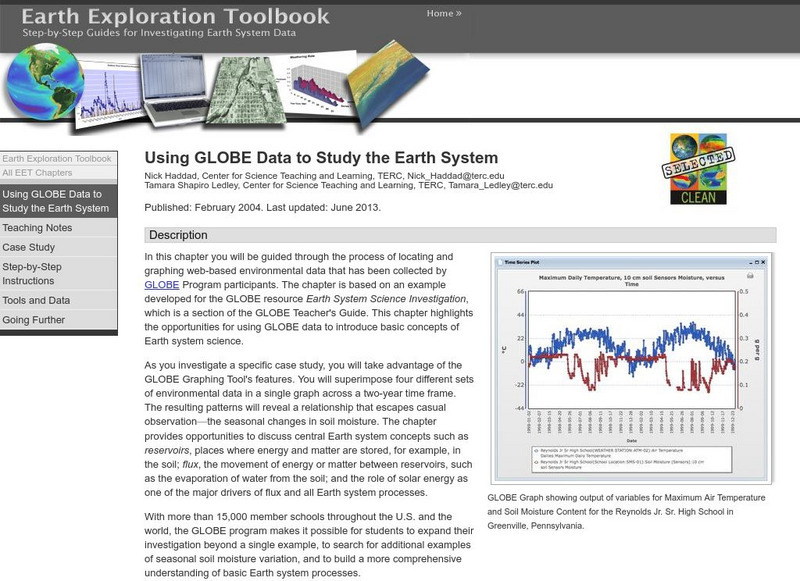
Serc: Using Globe Data to Study the Earth System
This lesson guides students through the process of locating and graphing web-based environmental data that has been collected by GLOBE Program participants. The lesson provides opportunities for using GLOBE data to introduce basic...
Texas Instruments
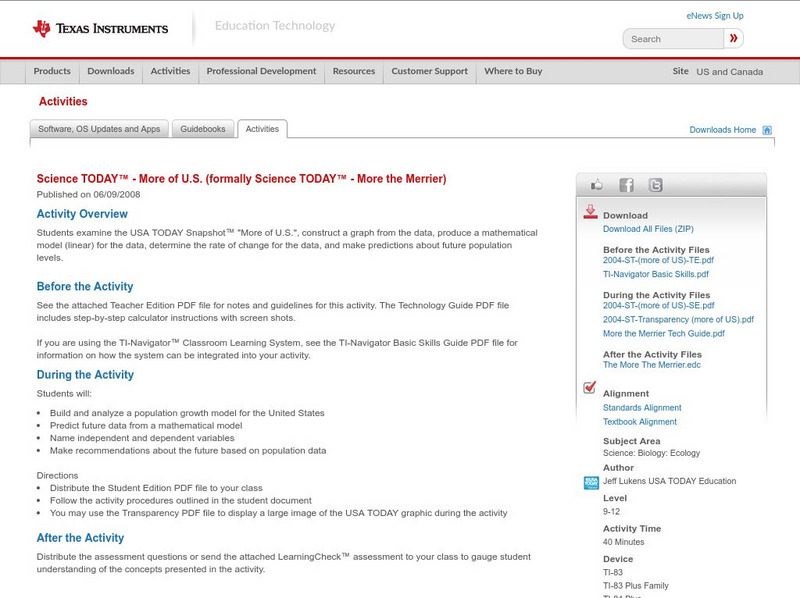
Texas Instruments: Science Today More of u.s.
Students examine the USA TODAY Snapshot "More of U.S.", construct a graph from the data, produce a mathematical model (linear) for the data, determine the rate of change for the data, and make predictions about future population levels.
Other
Science Fair Primer: Reporting the Results
A good explanation of the elements of a good science fair report written by a high school science teacher. Details are given step by step on stating the hypothesis, explaining the experimental procedure, presenting the data attained, and...
Khan Academy
Khan Academy: Representing Graphs
There are several ways to represent graphs, each with its advantages and disadvantages. Some situations, or algorithms that we want to run with graphs as input, call for one representation, and others call for a different representation....
Texas Instruments
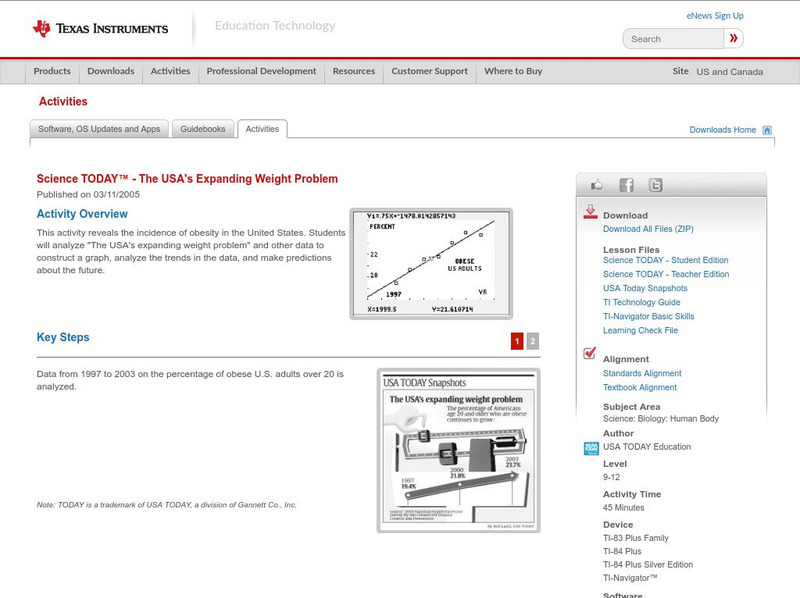
Texas Instruments: Science Today the Usa's Expanding Weight Problem
This activity reveals the incidence of obesity in the United States. Students will analyze "The USA's expanding weight problem" and other data to then construct a graph, analyze the trends in the data and make predictions about the future.
Other
Kindergarten lessons.com: Graphing Activities
Graphing activities for preschool and kindergarten include collecting data and organizing it in a variety of ways. There are lots of fun things to do in this area of math and the activities integrate well with science and literacy...
Khan Academy
Khan Academy: Storing Data in Variables
Practice variable assignment in the AP CSP pseudocode, in this set of free practice questions designed for AP Computer Science Principles students.
Khan Academy
Khan Academy: Basics of Enzyme Kinetics Graphs
Learn about the basics of enzyme kinetics graphs, and see examples of the graphs to understand the valuable data that is found on the graph. [12 min, 29 sec]


