Texas Education Agency
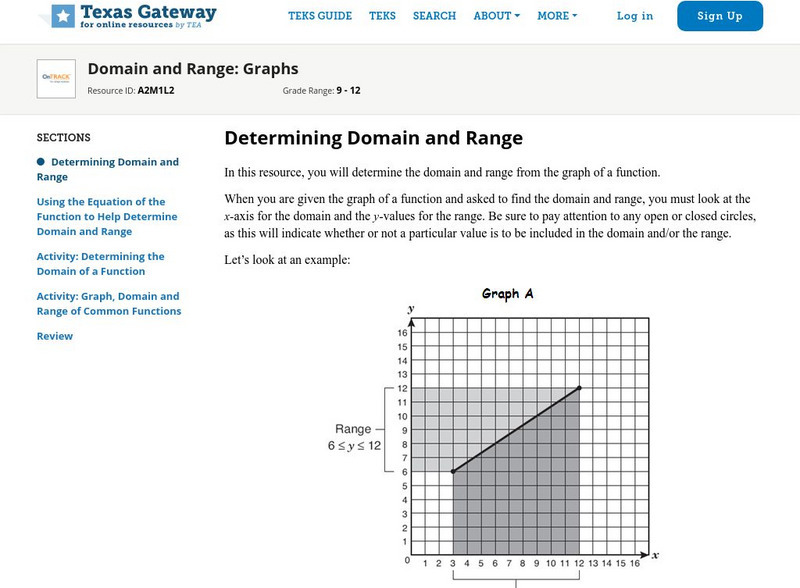
Texas Gateway: Domain and Range: Graphs
Given a function in graph form, identify the domain and range using set notation, interval notation, or a verbal description as appropriate.
PBS
Pbs: Interpreting Stories and Graphs
This interactive exercise focuses on how line graphs can be used to represent mathematical data and provides an opportunity to translate actions from a story into graph form, then to write your own story to coincide with a line graph.
Cuemath
Cuemath: Graphing a Quadratic Function
A comprehensive guide for learning all about how to graph a quadratic function with definitions, domain and range of quadratic function, vertex form, standard form, how to solve them, solved examples, and practice questions.
TeachEngineering
Teach Engineering: Forms of Linear Equations
Students learn about four forms of equations: direct variation, slope-intercept form, standard form and point-slope form. They graph and complete problem sets for each, converting from one form of equation to another, and learning the...
TeachEngineering
Teach Engineering: Using Graph Theory to Analyze Drama
Students analyze dramatic works using graph theory. They gather data, record it in Microsoft Excel and use Cytoscape (a free, downloadable application) to generate graphs that visually illustrate the key characters (nodes) and...
TeachEngineering
Teach Engineering: Growing and Graphing
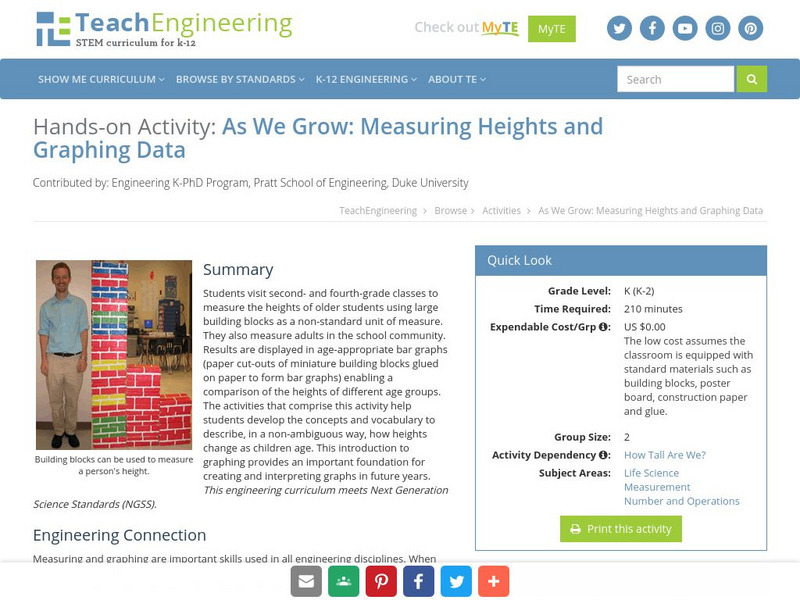
Students visit a 2nd and a 4th grade class to measure the heights of older students using large building blocks as a non-standard unit of measure. They can also measure adults in the school community. Results are displayed in...
Varsity Tutors
Varsity Tutors: Hotmath: Practice Problems: Graphing Linear Equations
Twenty-one problems present a variety of practice graphing linear equations. They are given with each step to the solution cleverly revealed one at a time. You can work each step of the problem then click the "View Solution" button to...
TeachEngineering
Teach Engineering: Graphing Equations on the Cartesian Plane: Slope
The lesson teaches students about an important characteristic of lines: their slopes. Slope can be determined either in graphical or algebraic form. Slope can also be described as positive, negative, zero or undefined. Students get an...
Vision Learning
Visionlearning: Data: Using Graphs and Visual Data in Science
An explanation of how data can be turned into visual forms which can help people comprehend information easier than observing numbers.
CK-12 Foundation
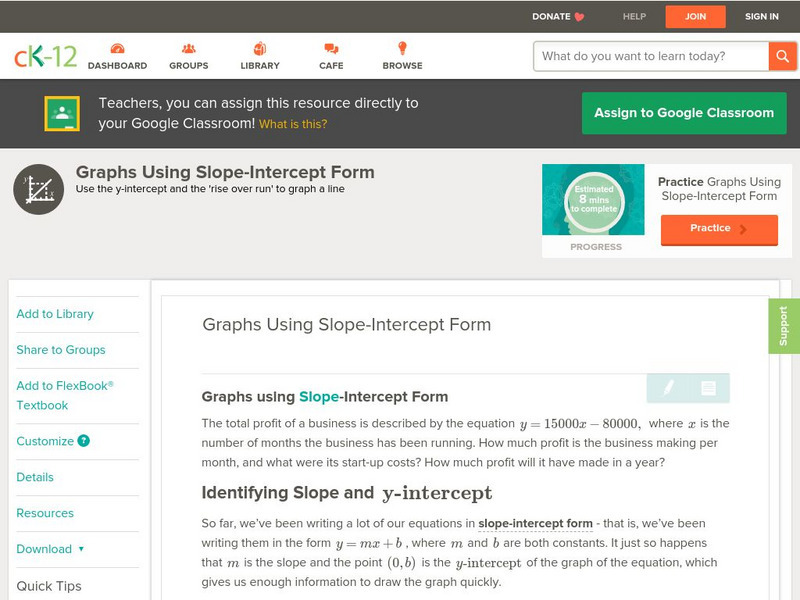
Ck 12: Algebra: Graphs Using Slope Intercept Form
[Free Registration/Login may be required to access all resource tools.] Learn how to graph lines using slope-intercept form.
CK-12 Foundation
Ck 12: Algebra: Graphs Using Slope Intercept Form
[Free Registration/Login may be required to access all resource tools.] Identify the slope and y-intercept of lines and graph linear equations that are in slope-intercept form.
Other
Nearpod: Graphing Linear Equations in Standard Form
In this instructional activity on a standard form, students explore how to identify and graph a linear equation in standard form.
CK-12 Foundation
Ck 12: Algebra: Graphs of Quadratic Functions in Intercept Form
[Free Registration/Login may be required to access all resource tools.] Find the x-intercepts and vertex of a quadratic function by writing it in intercept form and solve real-world problems. Students examine guided notes, review guided...
Khan Academy
Khan Academy: Graph From a Standard Form Equation
In this exercise, students practice graphing from a standard form equation. Students receive immediate feedback and have the opportunity to get hints and try questions repeatedly.
Khan Academy
Khan Academy: Graph Quadratics in Factored Form
Graph quadratic functions that are given in factored form. For example, graph y=(x-4)(x+2). Students receive immediate feedback and have the opportunity to try questions repeatedly, watch a video or receive hints.
CK-12 Foundation
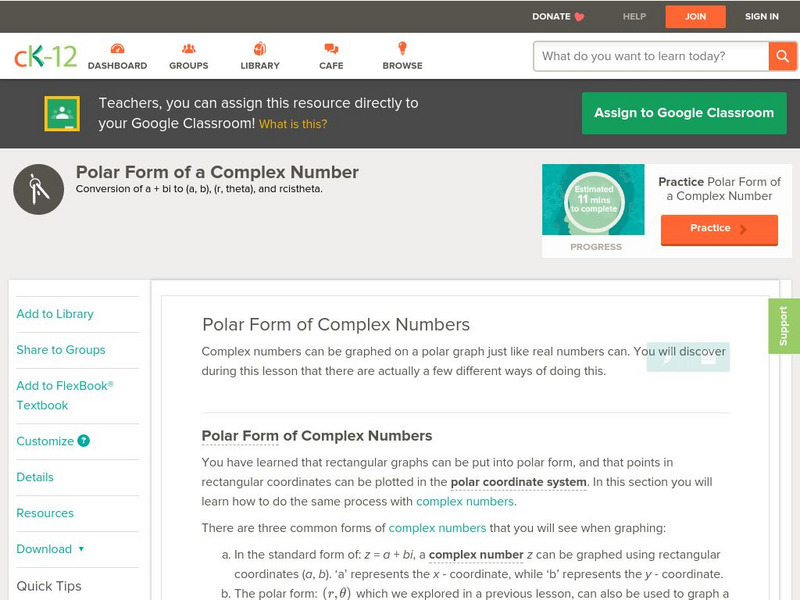
Ck 12: Polar Form of a Complex Number
[Free Registration/Login may be required to access all resource tools.] Here you will learn how to convert complex numbers from rectangular form to polar form. You will also explore the graphs of complex numbers on a polar graph.
Khan Academy
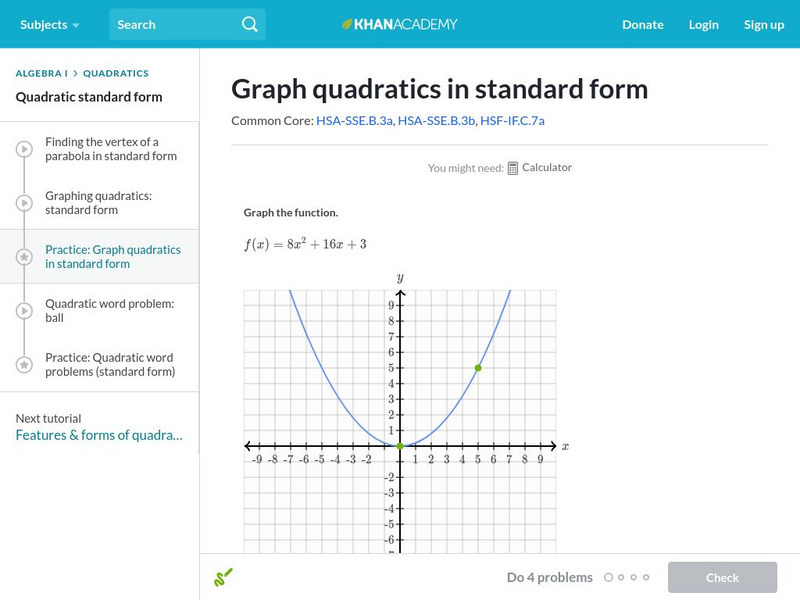
Khan Academy: Graph Quadratics in Standard Form
Graph quadratic functions given in the standard form a squared+bx+c. For example graph y=5x squared-20x+15. Students receive immediate feedback and have the opportunity to try questions repeatedly, watch a video or receive hints.
Khan Academy
Khan Academy: Graph From Linear Standard Form
Find the graph of a linear equation given in standard form.
Khan Academy
Khan Academy: Graph From Slope Intercept Form
Practice drawing the graph of a line given in slope-intercept form. For example, graph y = 3x + 2. Students receive immediate feedback and have the opportunity to try questions repeatedly, watch a video or receive hints.
CK-12 Foundation
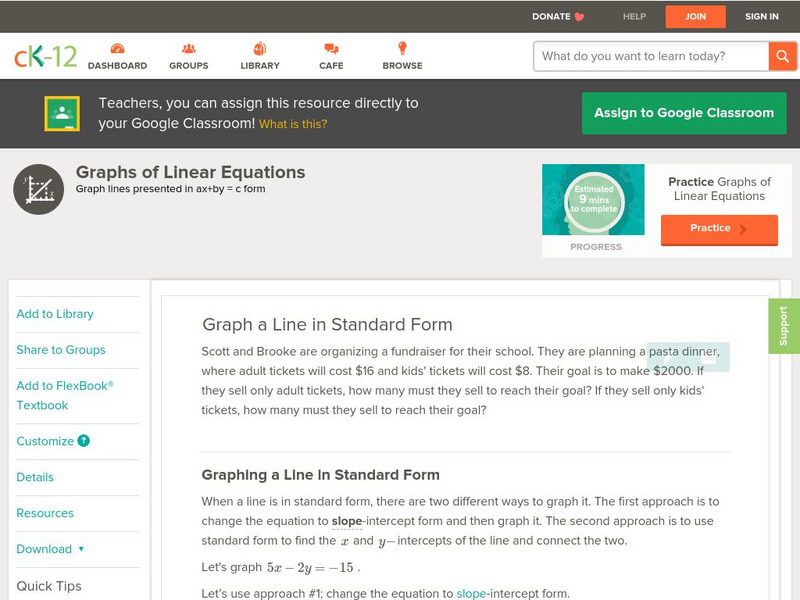
Ck 12: Algebra: Graphs of Linear Equations
[Free Registration/Login may be required to access all resource tools.] Students learn to graph the equation of a line in standard form. Students examine guided notes, review guided practice, watch instructional videos and attempt...
Khan Academy
Khan Academy: Graph Quadratics in Vertex Form
Graph quadratic functions that are given in the vertex form. Students receive immediate feedback and have the opportunity to try questions repeatedly, watch a video or receive hints.
PBS
Pbs: Manipulating Graphs
Watch how a graph is altered when key elements of the equation change. This lesson focuses on how to manipulate the equation of a line in slope intercept form to match the graphs provided deepening the understanding of both the slope and...
University of Colorado
University of Colorado: Ph Et Interactive Simulations: Graphing Slope Intercept
An interactive simulation that teaches about slope-intercept form and graphing linear equations through observations while connecting the slope and y-intercept to the line equations. This simulation can either be downloaded or played...
Analyze Math
Analyze Math: Graph of Sine, A*sin(bx+c), Function
The tutorial explores graphing and sketching sine functions of the form a*sin(bx+c). The activity has several examples with detailed solutions.
