Hi, what do you want to do?
Palomar Community College District
Palomar College: Behavioral Science Statistics: Frequency Histogram an Example
A step-by-step worked problem demonstrating how to take a set of data and produce a frequency histogram. Hints are provided along the way and the final graph is shown for the user to check.
Cuemath
Cuemath: Histograms
A comprehensive guide for learning all about histograms with definitions, solved examples, and practice questions.
Math Is Fun
Math Is Fun: Histograms
Explains, with examples, what a histogram is, how it differs from a bar graph, and how to interpret one. Includes a set of practice questions.
Missouri State University
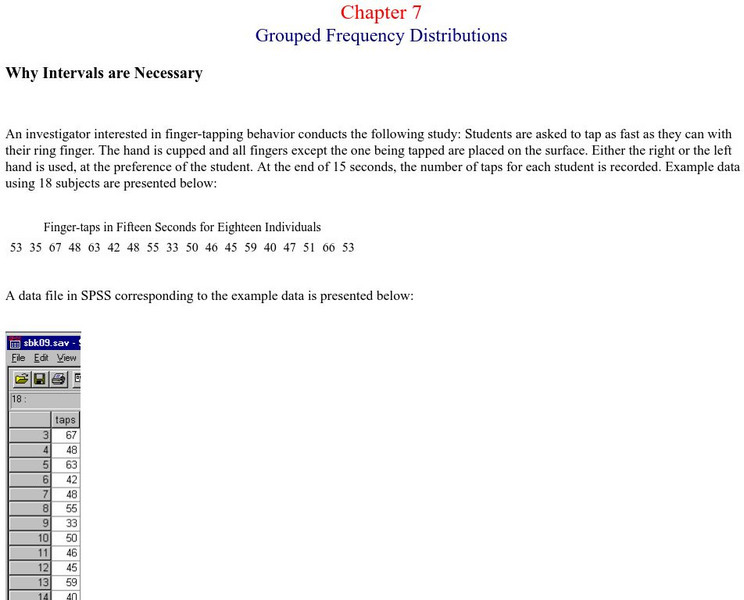
Missouri State Univ.: Introductory Statistics: Grouped Frequency Distributions
An example is provided for the explanation of grouped frequency distributions. Graphs show how to construct histograms and overlapping bell curves, and Excel documents are discussed as being useful here.
CK-12 Foundation
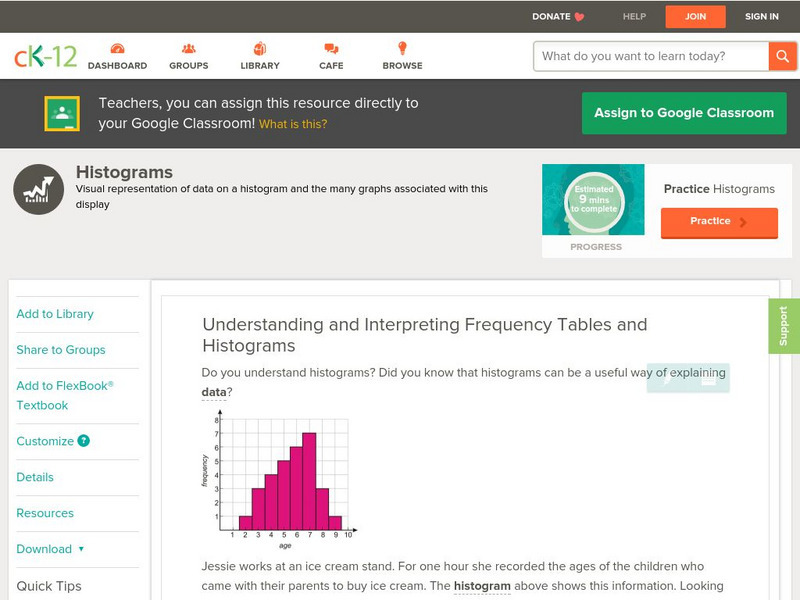
Ck 12: Statistics: Histograms Grade 8
[Free Registration/Login may be required to access all resource tools.] Students will interpret frequency tables and connect data to histograms.
CK-12 Foundation
Ck 12: Statistics: Histograms Grades 11 12
[Free Registration/Login may be required to access all resource tools.] This Concept covers making frequency tables and using them to create a histogram.
CK-12 Foundation
Ck 12: Statistics: Histograms Grade 7
[Free Registration/Login may be required to access all resource tools.] Make a histogram given a frequency table.
CK-12 Foundation
Ck 12: Statistics: Histograms Grades 9 10
[Free Registration/Login may be required to access all resource tools.] Make a histogram given a frequency table.
Better Lesson
Better Lesson: Histogram Activity
Sixth graders will see how an actuary uses histograms to analyze the frequency of events to determine risk.
Quia
Ixl Learning: Histograms
Brush up on your math skills relating to histograms then try some practice problems to test your understanding.
Stefan Warner and Steven R. Costenoble
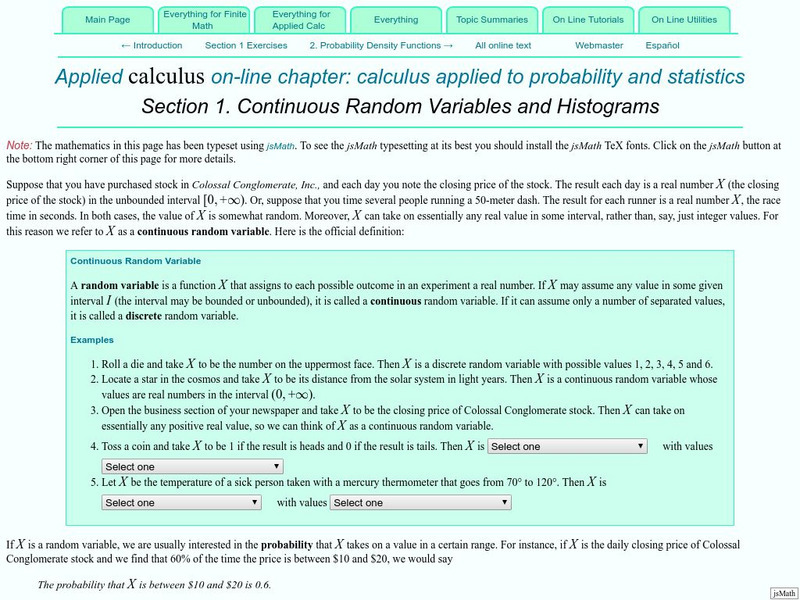
Finite Mathematics & Applied Calculus: Continuous Random Variables and Histograms
Students learn about random variables and histograms. Topics explored are continuous random variables, discrete random variables, probability, and frequency distributions. The tutorial investigtes the statistics concepts through class...
Wolfram Research
Wolfram Math World: Frequency Distribution
This site from MathWorld provides a general overview of frequency distribution, complete with a bar graph and explanatory text.
Texas Instruments
Texas Instruments: Glencoe: Graphing Calculator Investigation Histogram
Students will make histograms, find the frequency of each interval and explore the domain.
Khan Academy
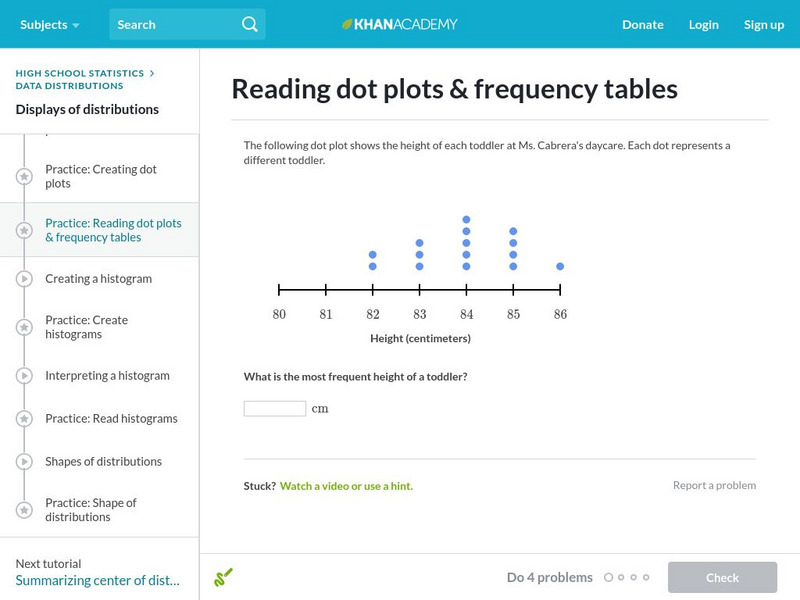
Khan Academy: Reading Dot Plots and Frequency Tables
In this exercise, students practice reading dot plots and frequency tables. Students receive immediate feedback and have the opportunity to get hints and try questions repeatedly.
CK-12 Foundation
Ck 12: Statistics: Frequency Polygons
[Free Registration/Login may be required to access all resource tools.] Construct frequency polygons.
Quia
Ixl Learning: Frequency Tables
Brush up on your math skills relating to frequency tables then try some practice problems to test your understanding.
McGraw Hill
Glencoe Mathematics: Online Study Tool: Quiz on Frequency Distributions
Learners demonstrate comprehension of advanced mathematical concepts. The online quiz tests the students on frequency distributions.
ClassFlow
Class Flow: Histograms Handling Data
[Free Registration/Login Required] In this Flipchart, students are introduced to the interpreting and creating histograms, finding the frequency density, and then graphing the results.
Other
Grinnell College: Histograms Area of Rectangles
A sample problem is provided to help you create a histogram using a frequency distribution chart. Sample charts and formulas are provided to help explain how to find the area of the rectangles in the histogram and how to interpret what...
Richland Community College
Richland College: Ti 82 Histograms / Box Plots
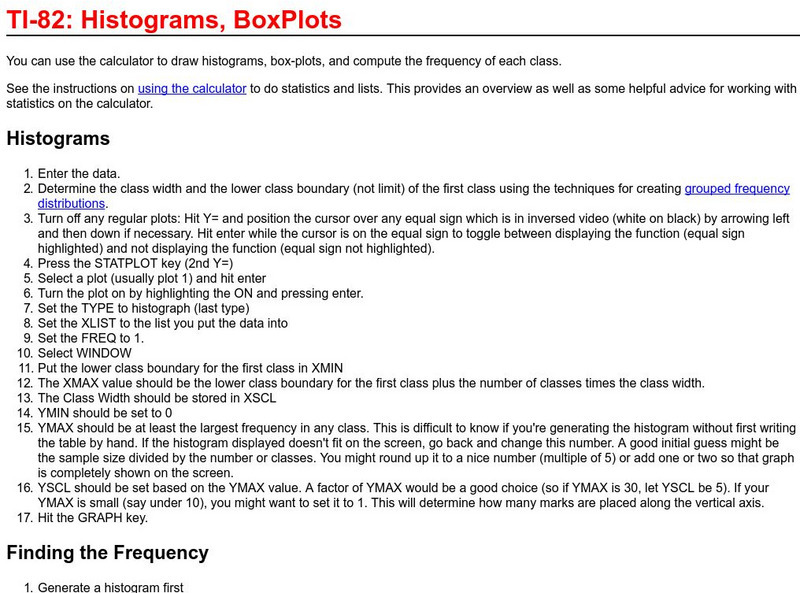
Richland College provides a step-by-step procedure on how to use a TI-82 to construct histograms and box plots and then use this to find frequency distribution.
Khan Academy
Khan Academy: Comparing Data Displays
Practice interpreting and comparing dot plots, histograms, and box plots. Students receive immediate feedback and have the opportunity to try questions repeatedly, watch a video or receive hints.
Texas Instruments
Texas Instruments: Statistics for Math B
Students will determine the mean, median, mode and standard deviation of collected data. They will make a frequency histogram of the grouped data, both on graph paper, and on the TI 83+.
PBS
Pbs Learning Media: Restocking Shoes
In this video from Cyberchase, Bianca uses data on past shoe sales to help her decide what quantities of each size she should order in the next shipment.
Other
Online Statistics Education: Graphing Distributions [Pdf]
This is the second chapter of a statistics e-text developed collaboratively by Rice University, University of Houston Clear Lake, and Tufts University. It looks at many different types of data displays and the advantages and...


