Cuemath
Cuemath: Frequency Distribution Table
A comprehensive guide for learning all about frequency distribution tables with definitions, how to create a frequency distribution table, and the formulas and graphs related to frequency distributions. With solved examples and...
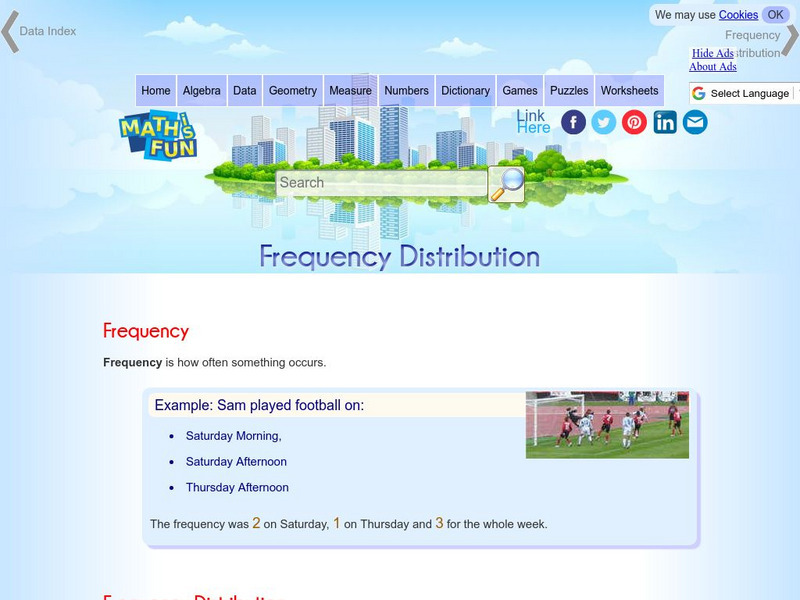
Math Is Fun
Math Is Fun: Frequency Distribution
Explains, with examples, what a frequency distribution table is. Includes a set of practice questions.
Missouri State University
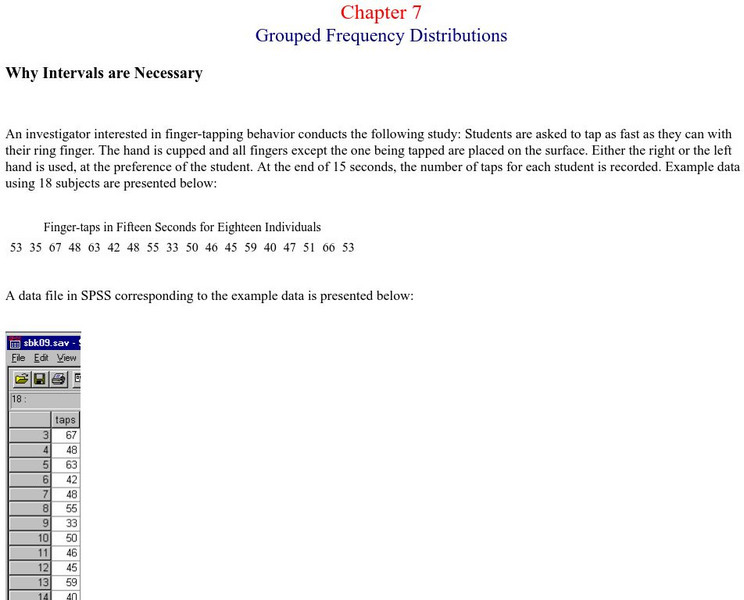
Missouri State Univ.: Introductory Statistics: Grouped Frequency Distributions
An example is provided for the explanation of grouped frequency distributions. Graphs show how to construct histograms and overlapping bell curves, and Excel documents are discussed as being useful here.
McGraw Hill
Glencoe: Self Check Quizzes 1 Frequency Tables
Use Glencoe's randomly generated self-checking quiz to test your knowledge of frequency tables. Each question has a "Hint" link to help. Choose the correct answer for each problem. At the bottom of the page click the "Check It" button...
CK-12 Foundation
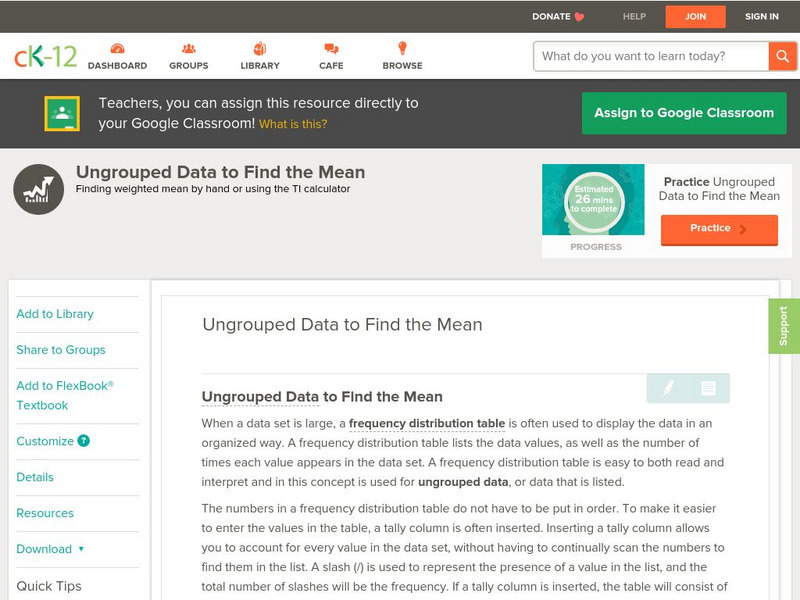
Ck 12: Statistics: Ungrouped Data to Find the Mean
[Free Registration/Login may be required to access all resource tools.] Covers frequency distribution tables with ungrouped data.
CK-12 Foundation
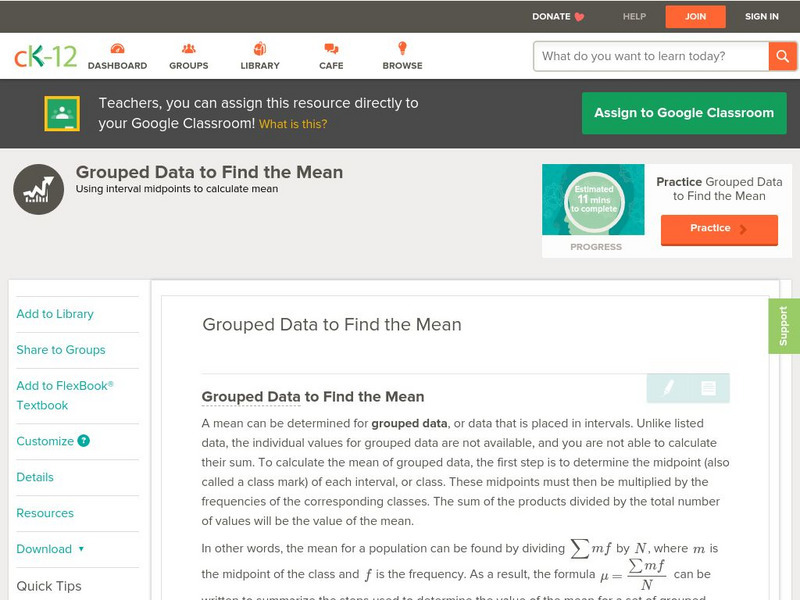
Ck 12: Statistics: Grouped Data to Find the Mean
[Free Registration/Login may be required to access all resource tools.] Covers frequency distribution tables with grouped data.
Mangahigh
Mangahigh: Data: Use Frequency Tables
This site provides students practice with the concept of frequency tables. Students can learn about the topic by completing an interactive tutorial. Students can then take a ten question timed test to practice the skill.
Other
Online Statistics Education: Graphing Distributions [Pdf]
This is the second chapter of a statistics e-text developed collaboratively by Rice University, University of Houston Clear Lake, and Tufts University. It looks at many different types of data displays and the advantages and...
Khan Academy
Khan Academy: Two Way Frequency Tables
Given a Venn diagram or information about a relationship, create a two-way frequency table. Students receive immediate feedback and have the opportunity to try questions repeatedly, watch a video, or receive hints.
Khan Academy
Khan Academy: Two Way Relative Frequency Tables
Practice creating two-way relative frequency tables from a two-way frequency table. Students receive immediate feedback and have the opportunity to try questions repeatedly, watch a video, or receive hints.
Khan Academy
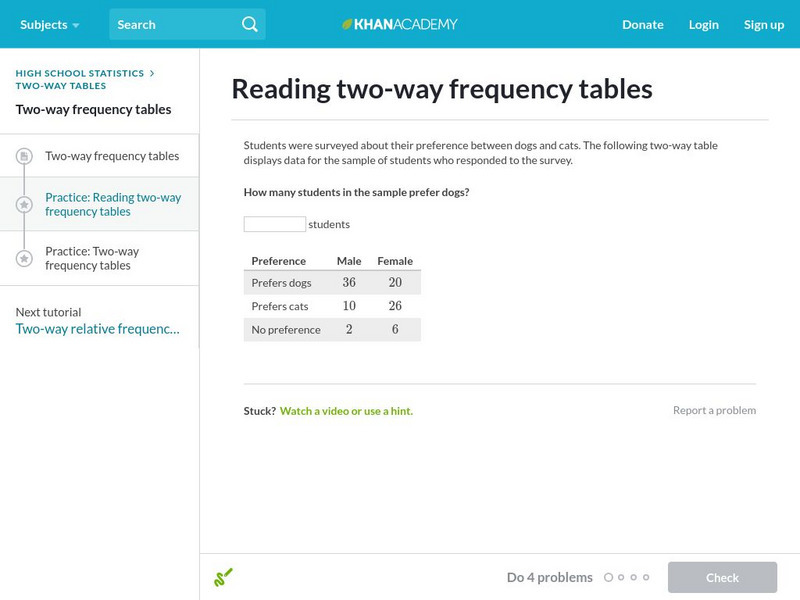
Khan Academy: Reading Two Way Frequency Tables
Practice interpreting two-way frequency tables. For example, what does the cell in the top left tell you? Students receive immediate feedback and have the opportunity to try questions repeatedly, watch a video, or receive hints.
Khan Academy
Khan Academy: Interpreting Two Way Tables
Do you understand how two-way tables really work? Here's your chance to practice. Students receive immediate feedback and have the opportunity to try questions repeatedly, watch a video, or receive hints.
Khan Academy
Khan Academy: Dot Plots and Frequency Tables Review
Dot plots and frequency tables are tools for displaying data in a more organized fashion. In this article, we review how to make dot plots and frequency tables.
Khan Academy
Khan Academy: Creating Frequency Tables
In this exercise, students practice creating frequency tables. Students receive immediate feedback and have the opportunity to get hints and try questions repeatedly.
CK-12 Foundation
Ck 12: Interactive Geometry: 11.4 Two Way Frequency Tables
With two pieces of data, learn how to organize the data into a two-way frequency table.
Quia
Ixl Learning: Frequency Tables
Brush up on your math skills relating to frequency tables then try some practice problems to test your understanding.
Khan Academy
Khan Academy: Two Way Tables Review
Two-way tables organize data based on two categorical variables.
Khan Academy
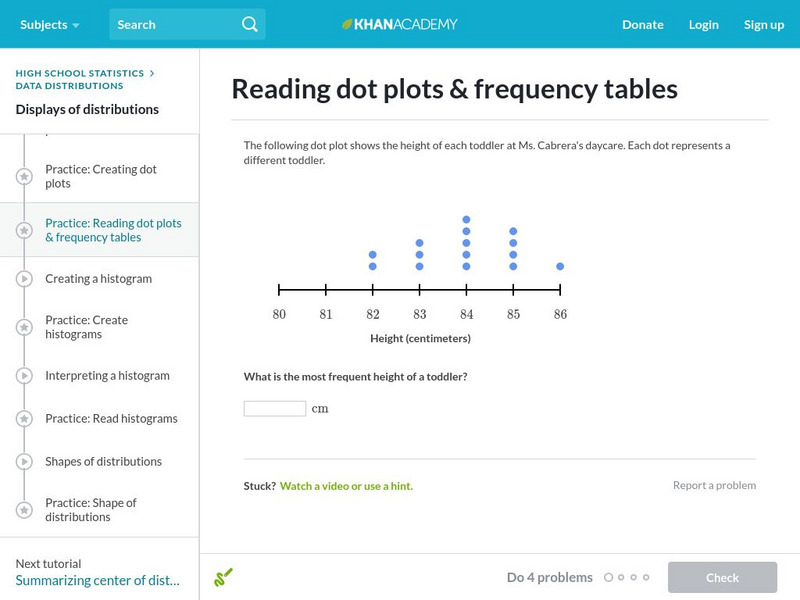
Khan Academy: Reading Dot Plots and Frequency Tables
In this exercise, students practice reading dot plots and frequency tables. Students receive immediate feedback and have the opportunity to get hints and try questions repeatedly.
Palomar Community College District
Palomar College: Frequency Polygon an Example
A step-by-step worked problem demonstrating how to take a set of data and produce a frequency polygon. Hints are provided along the way and the final graph is shown for the user to check.
Mangahigh
Mangahigh: Data: Find the Class Interval Containing the Mode
Students watch an online tutorial on the concept of finding mode from a frequency table. After watching, students test their knowledge by attempting ten practice problems that increase or decrease in difficulty based on their answers.
CK-12 Foundation
Ck 12: Statistics: Histograms Grades 11 12
[Free Registration/Login may be required to access all resource tools.] This Concept covers making frequency tables and using them to create a histogram.
Khan Academy
Khan Academy: Conditional Distributions and Relationships
A small private college was curious about what levels of students were getting straight A grades. College officials collected data on the straight A status from the most recent semester for all of their undergraduate and graduate students.
ClassFlow
Class Flow: Cumulative Frequency Data Handling
[Free Registration/Login Required] Students draw conclusions and engage in tables and charts involving cumulative frequency; a wonderful review of student's knowledge.
Varsity Tutors
Varsity Tutors: Hotmath: Practice Problems: Tables and Graphs
Six problems present various aspects of using and making tables and graphs to display statistics. They are given with each step to the solution cleverly revealed one at a time. You can work each step of the problem then click the "View...

