Science Education Resource Center at Carleton College
Serc: Analyzing Forces and Motion Graphs by Riding an Elevator
A high school physics lab on classical mechanics in which students study force versus time and acceleration versus time. Students need access to an elevator to complete the experiments. A lab handout is provided.
Science Education Resource Center at Carleton College
Serc: Investigating Motion Graphing Speed
In this introduction to motion activity, learners will get a personal understanding of speed and acceleration by experiencing it firsthand. Wheeled office chairs or other cart like devices are used to give one student a ride as a fellow...
Texas Education Agency
Texas Gateway: Kinematics: Graphical Analysis of One Dimensional Motion
By the end of this section, you will be able to describe a straight-line graph in terms of its slope and y-intercept, determine average velocity or instantaneous velocity from a graph of position vs. time, determine average or...
CK-12 Foundation
Ck 12: Physics: Motion Study Guide
This study guide on motion covers some key vocabulary and terms to describe motion: displacement vs. distance, acceleration, speed vs. velocity, and instantaneous vs. average. It includes graphs showing distance vs. time, velocity vs....
CK-12 Foundation
Ck 12: Episd: Velocity Time Graphs
[Free Registration/Login may be required to access all resource tools.] Break down graphs illustrating velocity and time to understand motion.
CK-12 Foundation
Ck 12 Exploration Series: Simulations: Physics: Irwin and Ruthie
[Free Registration/Login Required] Learn about the relationship between position, velocity, and acceleration for two objects in one-dimensional motion. Experiment with varying approaches to the race for both Irwin and Ruthie to see how...
OpenStax
Open Stax: Graphical Analysis of One Dimensional Motion
In the following interactive module students will describe a straight-line graph in terms of its slope and y-intercept. They will determine average velocity or instantaneous velocity from a graph of position vs. time.
University of Colorado
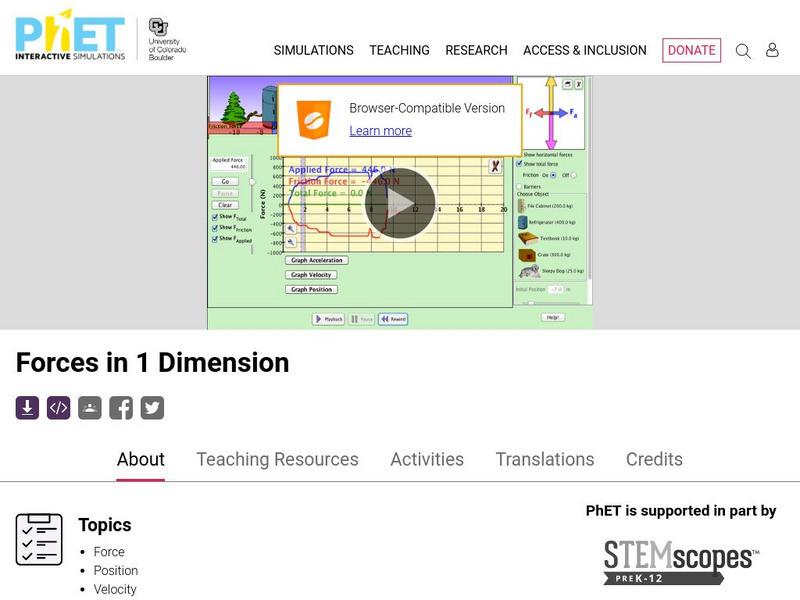
University of Colorado: Ph Et Interactive Simulations: Forces in One Dimension
Use this simulation to see the results of applying a force to move an object. Analyze forces and friction using graphs.
Texas Education Agency
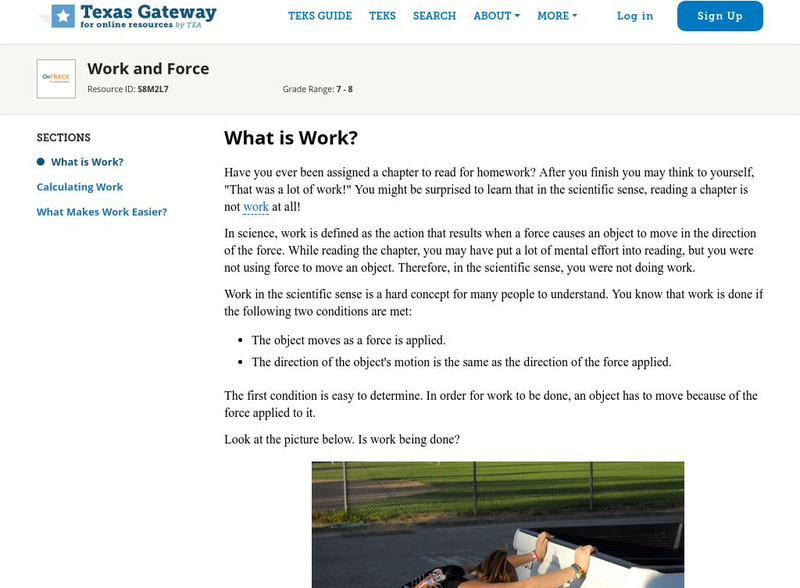
Texas Gateway: Work and Force
Given descriptions, illustrations, graphs, or charts, students will contrast situations where work is done with different amounts of force to situations where no work is done, such as moving a box with a ramp and without a ramp or...
Texas Education Agency
Texas Gateway: Changes in Motion
In this lesson, you will learn about position vs. time graphs and velocity vs. time graphs and how to use them to solve problems.
CK-12 Foundation
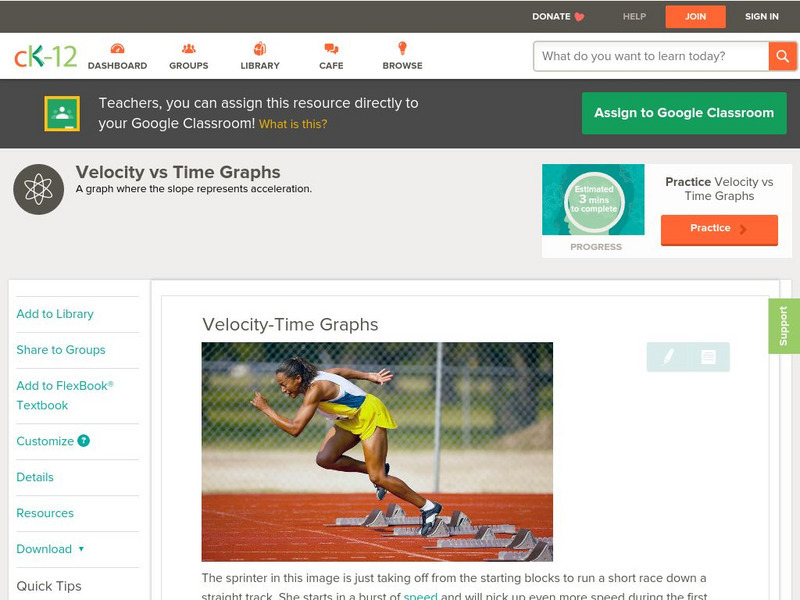
Ck 12: Physical Science: Velocity Time Graphs
[Free Registration/Login may be required to access all resource tools.] How to draw a velocity-time graph and what it represents.
Concord Consortium
Concord Consortium: Stem Resources: Motion on a Ramp
Using a motion detector, students produce graphs that show the motion of a toy car as it moves on a ramp. Students collect distance versus time graphs and velocity versus time graphs as well as predict what the motion will look like on...
Texas Instruments
Texas Instruments: Graphing Motion
This activity assesses students' knowledge and understanding of graphing motion.
CK-12 Foundation
Ck 12: Episd: Position Time Graphs
[Free Registration/Login may be required to access all resource tools.] Understand how to evaluate data presented in graphs based on speed and velocity calculations.
BioEd Online
Bio Ed Online: Balloon Blast
In the following instructional activity students are asked to devise a plan to measure the distance of a balloon's flight, predict the direction a balloon will travel as it deflates, learn about Newton's Laws of Motion, experience...
CK-12 Foundation
Ck 12: Physical Science: Position Time Graphs
[Free Registration/Login may be required to access all resource tools.] How motion and speed can be represented by a distance-time graph and how average speed can be calculated from it.
Physics Classroom
The Physics Classroom: Circular and Satellite Motion: Roller Coaster Model
An interactive playground for students to explore the physics of roller coasters. Learners investigate by changing the variables of force, velocity, friction, and vectors. Energy bar charts are displayed as the coaster car moves along...
TeachEngineering
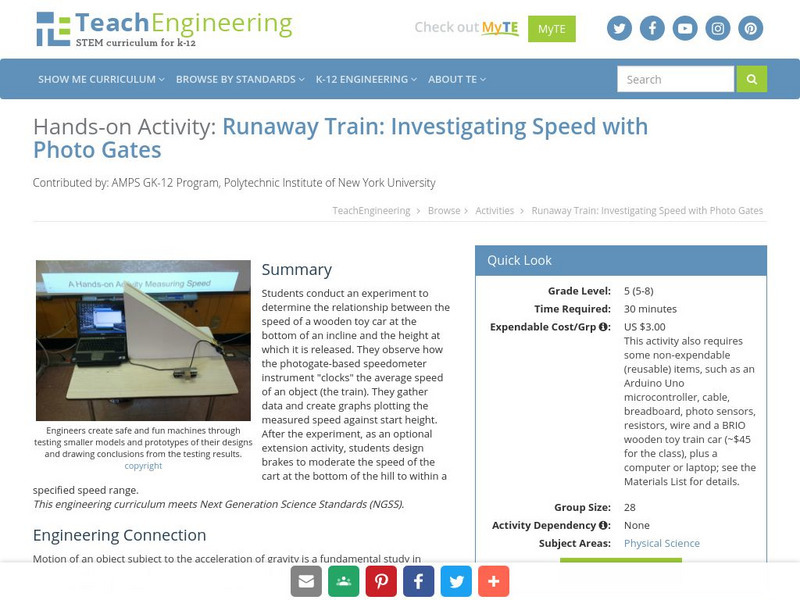
Teach Engineering: Runaway Train: Investigating Speed With Photo Gates
Students conduct an experiment to determine the relationship between the speed of a wooden toy car at the bottom of an incline and the height at which it is released. They observe how the photogate-based speedometer instrument "clocks"...
Science Education Resource Center at Carleton College
Serc: Newton's Second Law: How Does Acceleration Change With Varying Forces?
In this lab activity, young scholars investigate the effects of changing force on the acceleration of a lab cart testing Newton's Second Law of Motion. They will use distance and time to calculate velocity and create a graph representing...
CK-12 Foundation
Ck 12 Exploration Series: Simulations: Physics: Butterfly Stroke
[Free Registration/Login Required] Learn about the relationship between velocity and position for a swimmer. Adjust the velocity of the legs, streamline, and arms to experiment with the slope of velocity in the simulation swimmer. Dig a...
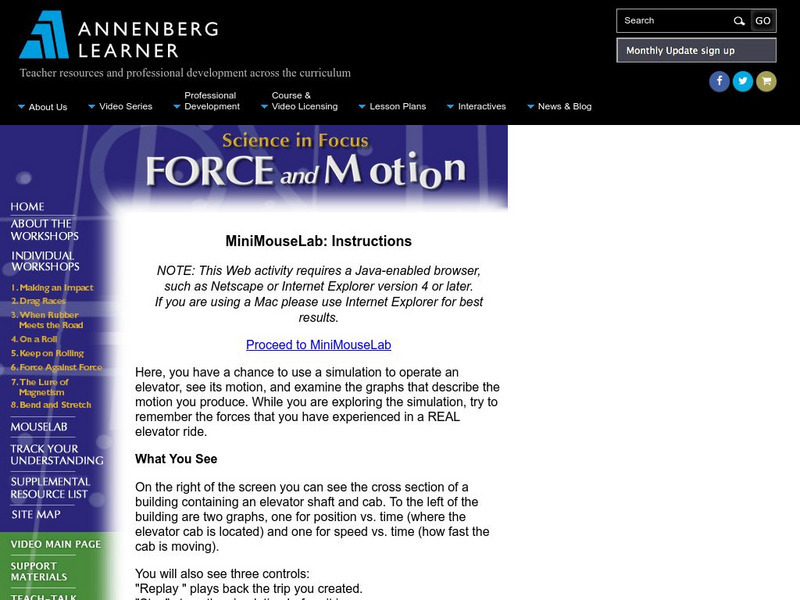
Annenberg Foundation
Annenberg Learner: Mini Mouse Lab
Use a simulation to operate an elevator and see its motion. Examine the graphs that describe the motion you produce.
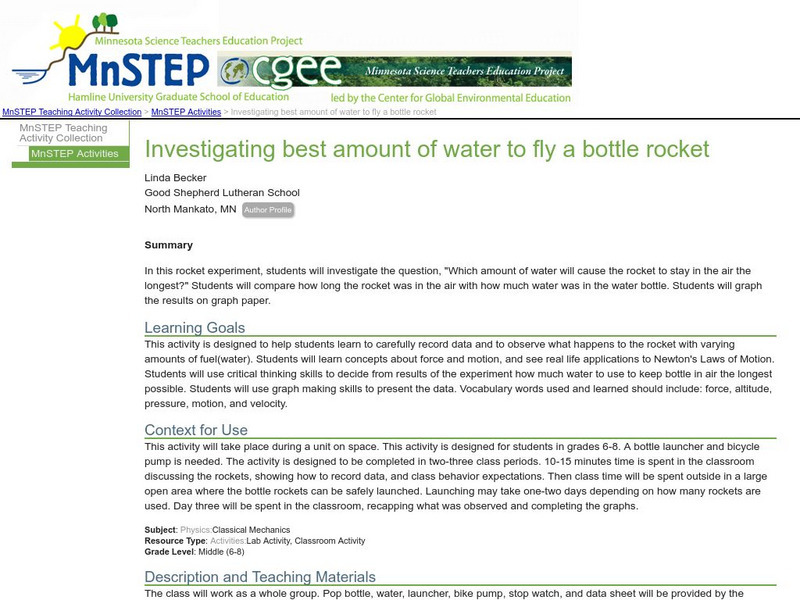
Science Education Resource Center at Carleton College
Serc: Investigating Best Amount of Water to Fly a Bottle Rocket
In this rocket experiment, students will investigate the question, "Which amount of water will cause the rocket to stay in the air the longest?" Students will compare how long the rocket was in the air with how much water was in the...
Physics Aviary
Physics Aviary: Circular Force Lab
This lab is designed to have students find the relationships that affect the force required to keep an object moving in a circle. Students will be able to modify the mass of the object, the speed of the object and the size of the circle...
Concord Consortium
Concord Consortium: Stem Resources: Building a Bungee Jump
Students are asked to create a bungee jump that will protect a hard-boiled egg from breaking. A force sensor is needed to measure the push/pull forces on the egg. Data is inserted into force-time graphs. After completing three...
