Hi, what do you want to do?
Khan Academy
Khan Academy: Unit: Modeling Data Distributions
A complete unit with tutorials, text, and practice over modeling data distributions.
Khan Academy
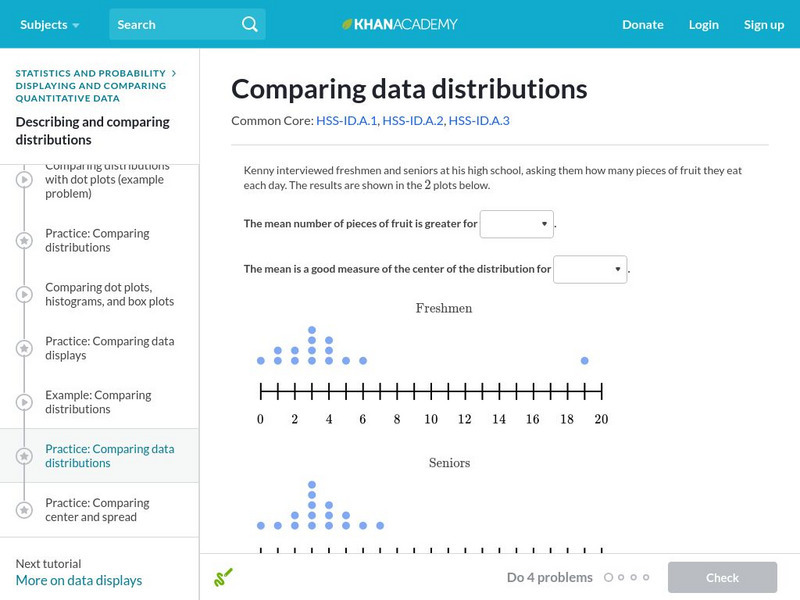
Khan Academy: Comparing Data Distributions
Take a look at two different data distributions and draw some comparisons.
Khan Academy
Khan Academy: Comparing Data Distributions
Take a look at two different data distributions and draw some comparisons. Students receive immediate feedback and have the opportunity to try questions repeatedly, watch a video or receive hints.
Texas Education Agency
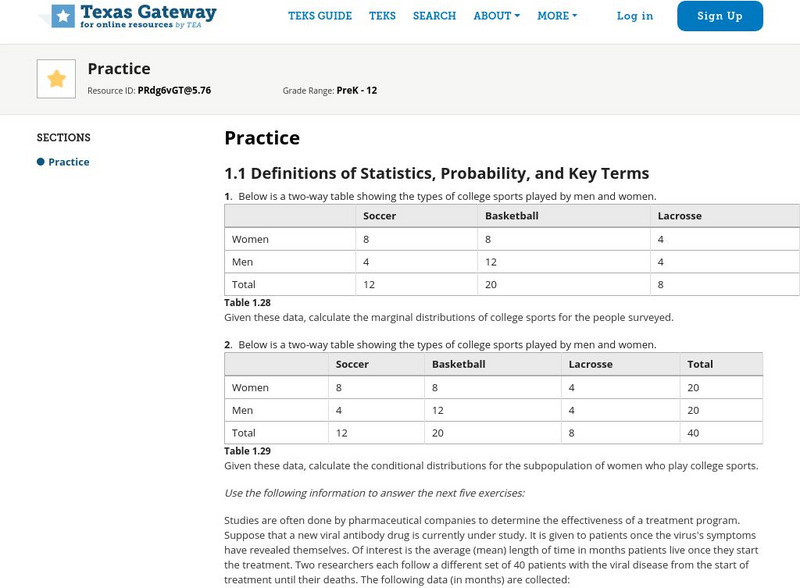
Texas Gateway: Data, Sampling, and Variation in Data and Sampling
This learning module discusses quantitative and qualitative data, the use of two-way tables in marginal and conditional distributions, how to display data, variation in data and samples, and how to critically evaluate statistical...
Khan Academy
Khan Academy: Splitting Data Into Related Tables
See how data distributed across multiple tables are related to each other in some way.
Yale University
Yale University: Categorical Data Examples
Site provides some different examples of categorical data and discusses the use of two-way tables.
Texas Instruments
Texas Instruments: Describing Categorical Data
Students analyze the distribution of categorical data. They calculate percents and visually compare the data sets with a bar chart.
Texas Education Agency
Texas Gateway: Tea Statistics: Sampling and Data: Practice
A set of exercises where students must analyze statistcal data and methodology and answer questions about distributions, sampling, results, accuracy, frequency, experimental design, and ethical practices.
US Census Bureau
U.s. Census Bureau: Age Data
This website has data available on age at the following levels: National, State, County, and other. Other statistical sections are "International Data," "Baby Boomer," "Older (55+) Population," and "Elderly (65+) Population."
Khan Academy
Khan Academy: Shape of Distributions
Practice determining if the data displayed represents left-tailed, right-tailed, or symmetrical data distribution.
Texas Instruments
Texas Instruments: Comparing Distributions of Univariate Data
Students compare univariate data distributions using statistical concepts like box plots, stem plots, and histograms.
Khan Academy
Khan Academy: Effects of Shifting, Adding, & Removing a Data Point
Practice figuring out how the mean and median are affected when a data point is added to, taken from, or shifted within a data set. Students receive immediate feedback and have the opportunity to try questions repeatedly, watch a video...
Texas Instruments
Texas Instruments: Special Cases of Normally Distributed Data
Students perform single and two-sample t procedures to investigate special cases of normally distributed data. They explore inference for a least-square regression line, including the confidence interval.
CK-12 Foundation
Ck 12: Statistics: Grouped Data to Find the Mean
[Free Registration/Login may be required to access all resource tools.] Covers frequency distribution tables with grouped data.
Khan Academy
Khan Academy: Transforming Data Problem
It is very common to take data and apply the same transformation to every data point in the set. For example, we may take a set of temperatures taken in degrees fahrenheit and convert them all to degrees celsius. How would this...
CK-12 Foundation
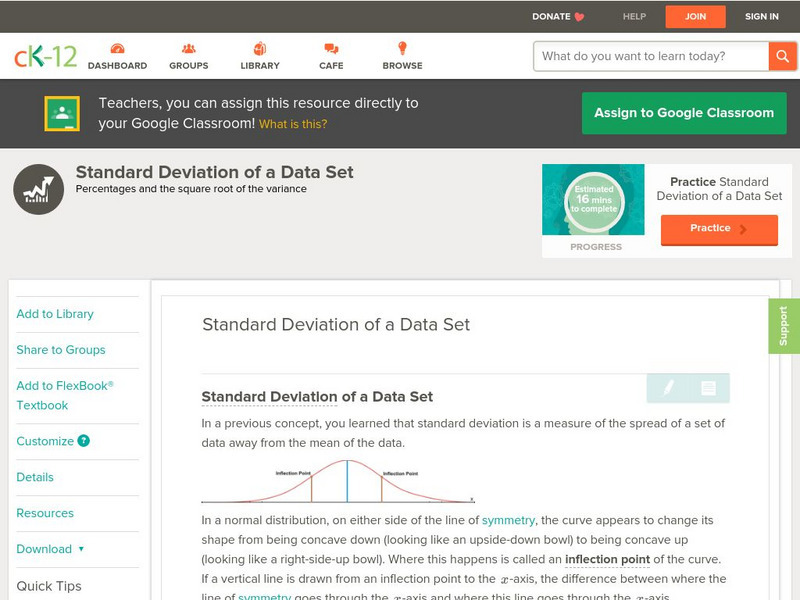
Ck 12: Statistics: Standard Deviation of a Data Set
[Free Registration/Login may be required to access all resource tools.] Learn about standard deviation of normally distributed data.
Texas Education Agency
Texas Gateway: Evaluating Methods of Sampling From a Set of Data
Given a problem situation, the student will evaluate a method of sampling to determine the validity of an inference made from the set of data.
Beacon Learning Center
Beacon Learning Center: All That Data 2
Students describe graphs and explore range, measures of central tendency, and distribution in this interactive web lesson.
Illustrative Mathematics
Illustrative Mathematics: Understanding the Standard Deviation
The purpose of this task is to deepen student understanding of the standard deviation as a measure of variability in data distribution. The task is divided into four parts, each of which asks young scholars to think about standard...
Other
Online Statistics Education: Graphing Distributions [Pdf]
This is the second chapter of a statistics e-text developed collaboratively by Rice University, University of Houston Clear Lake, and Tufts University. It looks at many different types of data displays and the advantages and...
Texas Instruments
Texas Instruments: Summarizing Distributions of Univariate Data
Students understand statistical concepts like center of data and the amount of data variation from the center. They calculate the measures of the center of a distribution and the measures of spread for the data collected as a list....
Texas Instruments
Texas Instruments: Distributions and Univariate Data
This set contains statistics questions comparing distributions of univariate data. The student is asked to note the differences between distributions regarding center, shape, spread, and existence of outliers.
CK-12 Foundation
Ck 12: Statistics: Basic Graph Types
[Free Registration/Login may be required to access all resource tools.] Organize distributions of data by using a number of different methods.
Science Education Resource Center at Carleton College
Serc: Mn Step: Statistical Analysis of Lincoln
For this activity, young scholars first work in groups to collect information about a set of pennies. They measure and record the mass for each one in a table using a spreadsheet program if possible. They also record its year and, for...









![Online Statistics Education: Graphing Distributions [Pdf] eBook Online Statistics Education: Graphing Distributions [Pdf] eBook](https://static.lp.lexp.cloud/images/attachment_defaults/resource/large/FPO-knovation.png)


