Hi, what do you want to do?
Scholastic
Scholastic: Study Jams! Math: Data Analysis: Line Plots
Explore how to organize and plot data on a line plot by going step by step through the activity. Then test your knowledge to check for understanding.
CK-12 Foundation
Ck 12: Statistics: Displaying Bivariate Data
[Free Registration/Login may be required to access all resource tools.] This Concept shows students how to display bivariate data using scatter plots and line plots.
Scholastic
Scholastic: Cultivating Data
Students will understand key concepts of data analysis and their graphic representations. Students will construct and interpret data tables, line plots, box-and-whisker plots and stem-and-leaf plots, scatterplots with line of best fit,...
Texas Instruments
Texas Instruments: Bivariate Data
This set contains statistics questions regarding bivariate data: scatter plots, the least-squares regression line, and their interpretation. The student is asked about the meaning of the various strengths and directions of linear...
Other
National Security Agency: Line Plots: Frogs in Flight [Pdf]
Students learn how to construct and interpret line plots. The lesson plan describes an activity that has students collect data, create line plots, and interpret and analyze the data.
Texas Education Agency
Texas Gateway: Modeling Data With Linear Functions
Given a scatterplot where a linear function is the best fit, the student will interpret the slope and intercepts, determine an equation using two data points, identify the conditions under which the function is valid, and use the linear...
Better Lesson
Better Lesson: Line Plot Activity
This lesson will tap into US History and the ages of presidents during their inauguration and describing the data in a line plot.
Texas Education Agency
Texas Gateway: Selecting and Using Representations for Collected Data
[Accessible by TX Educators. Free Registration/Login Required] Given a variety of data (including line plots, line graphs, stem and leaf plots, circle graphs, bar graphs, box and whisker plots, histograms, and Venn diagrams), the student...
Khan Academy
Khan Academy: Read Line Plots (Data With Fractions)
Practice reading and interpreting data that is graphed on line plots. The data graphed includes fractions. Students receive immediate feedback and have the opportunity to try questions repeatedly, watch a video or receive hints....
Khan Academy
Khan Academy: Make Line Plots
Practice creating line plots (dot plots) from data sets. Students receive immediate feedback and have the opportunity to try questions repeatedly, watch a tutorial video, or receive hints.
Khan Academy
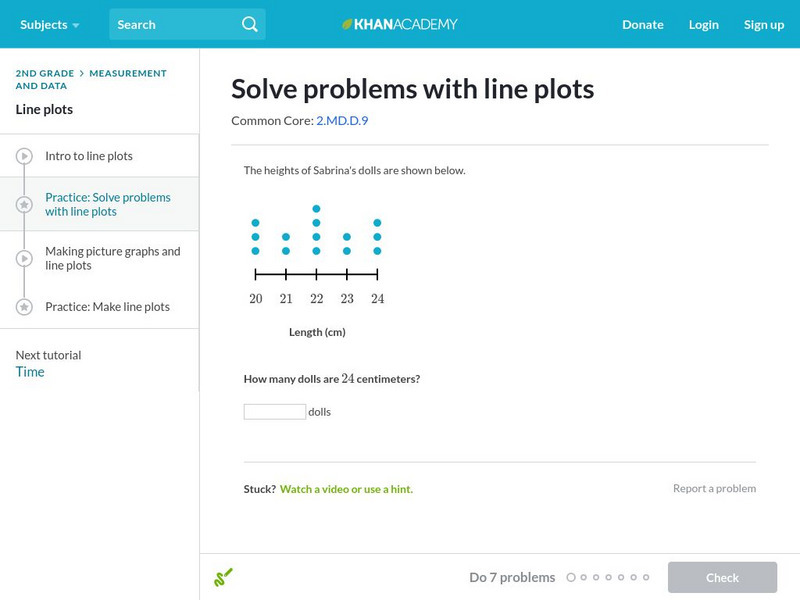
Khan Academy: Solve Problems With Line Plots
Answer questions using line plots and data sets. Students receive immediate feedback and have the opportunity to try questions repeatedly, watch a tutorial video, or receive hints.
CK-12 Foundation
Ck 12: Statistics: Line Plots From Frequency Tables
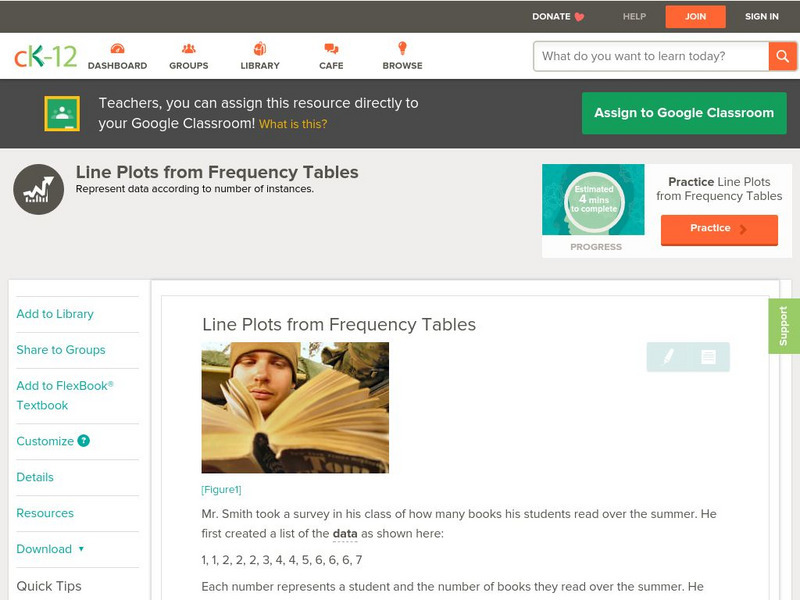
[Free Registration/Login may be required to access all resource tools.] Create a line plot given data organized in a frequency table.
Quia
Ixl Learning: Line Plots
Brush up on your math skills relating to line plots then try some practice problems to test your understanding.
Beacon Learning Center
Beacon Learning Center: All That Data
Students analyze data by finding the mean, median, mode, and range of a set of numbers. Line plots, bar graphs, and circle graphs are also included in this lesson.
Louisiana Department of Education
Louisiana Doe: Louisiana Believes: Eureka Math Parent Guide: Problem Solving With Length, Money, and Data
A guide to support parents as they work with their students with problem solving with length, money, and data.
CPALMS
Cpalms: Measure Up! Measuring to Make a Line Plot
[Free Registration/Login Required] In this lesson, students will generate measurement data by measuring lengths using rulers marked with halves and fourths of an inch and show the data by making a line plot. This lesson includes an...
CK-12 Foundation
Ck 12: Algebra: Fitting Lines to Data
[Free Registration/Login may be required to access all resource tools.] Make a scatter plot of data and find the line of best fit to represent that data.
CK-12 Foundation
Ck 12: Types of Data Representation: Graphic Displays of Data
[Free Registration/Login may be required to access all resource tools.] Here you will explore displays of data using bar charts, histograms, pie charts and boxplots, and learn about the differences and similarities between them and how...
Khan Academy
Khan Academy: Line Plots Review
Reviews what line plots are and how to make them. Includes some practice problems with explanations of the solutions.
Cuemath
Cuemath: Data Handling
This comprehensive guide about data handling helps with understanding how the study of data handling and graphical representation of the data along with other tools help us in dealing with numerical data. Includes solved examples and...
Oswego City School District
Regents Exam Prep Center: Categorizing Data
Three lessons on different types of data (qualitative, quantitative, univariate, bivariate, biased data) as well as a practice activity and teacher resource.
Annenberg Foundation
Annenberg Learner: Creating a Line Plot
Watch as a physical stack of coins is added as a series of dots to a line plot.
Khan Academy
Khan Academy: Graph Data on Line Plots
Record measurements on line plots (also called dot plots). Students receive immediate feedback and have the opportunity to try questions repeatedly, watch a video or receive hints.
Khan Academy
Khan Academy: Practice: Make Line Plots
A practice quiz where students construct line plots using the information given in the problems. Includes hints.


![National Security Agency: Line Plots: Frogs in Flight [Pdf] Lesson Plan National Security Agency: Line Plots: Frogs in Flight [Pdf] Lesson Plan](https://content.lessonplanet.com/knovation/original/122495-587001a487c71ef32e76fdab66ff794e.jpg?1661494304)


