Hi, what do you want to do?
Utah Education Network
Uen: Balanced Diet
In this lesson, 2nd graders will learn about the components of a balanced diet. Students will analyze charts and then self-report their own foods in categories. Several fiction and nonfiction books are listed as additional resources.
Texas Education Agency
Texas Gateway: Analyze Graphical Sources: Practice 2 (English I Reading)
This lesson focuses on practice exercises to understand and interpret the data in a graphic representations including pie charts, bar graphs, and line graphs.
Scholastic
Scholastic: Bars, Lines, and Pies
Students will learn and reinforce skills for creating, applying and analyzing pie charts, bar graphs and line graphs.
Texas Education Agency
Texas Gateway: Analyze Graphical Sources: Practice 2 (English Ii Reading)
[Accessible by TX Educators. Free Registration/Login Required] Analyze the factual, quantitative, and technical data in graphs and charts.
Utah Education Network
Uen: Familiarizing Students With the 5 Food Groups
This module provides a multiple-day unit about the five food groups. Teachers of the unit will explicitly teach students about analyzing charts. Then students will gain exposure with written and visual resources to help apply the...
Better Lesson
Better Lesson: Circle Graph Activity
This lesson will allow the student to work through three stations. The stations will focus on creating and analyzing circle graphs. The students will be using technology to create their graphs along with a hands-on activity using M&M's.
Texas Education Agency
Texas Gateway: Analyze Graphical Sources: Practice 2 (English I Reading)
You will look at each of these types of graphs: bar graph, line graph, pie charts, as you work your way through the lesson.
Better Lesson
Better Lesson: Circle Graph Activity
This lesson will allow the student to work through three stations. The stations will focus on creating and analyzing circle graphs. The students will be using technology to create their graphs along with a hands on activity using M &...
Oswego City School District
Regents Exam Prep Center: Practice With Organizing and Interpreting Data
Several problems are presented to test your skills in creating and interpreting frequency tables, pie charts, box-and-whisker and stem-and-leaf plots.
ClassFlow
Class Flow: Charts Handling Data
[Free Registration/Login Required] Reading graphs fit together with this engaging, colorful flipchart analyzing pie charts, bar graph, percents, and fractions.
Texas Education Agency
Texas Gateway: Data Analysis
Given laboratory investigation data in the form of tables, charts, and graphs, students will analyze and predict trends from the data.
Khan Academy
Khan Academy: Reading Dot Plots & Frequency Tables
Practice reading basic dot plots and frequency tables. Students receive immediate feedback and have the opportunity to try questions repeatedly, watch a video or receive hints.
Other
Tulpehocken Area School District: Graphing and Analyzing Scientific Data
Student worksheet with explanation of pie, bar, and line graphs, the parts of a graph, and the definition of mean, median, and mode. This summary is followed by an exercise for each type of graph within a scientific context.
Better Lesson
Better Lesson: Analyzing and Creating Circle Graphs
Sixth graders will be learning through exploration on how to analyze and create circle graphs and Venn diagrams.
Texas Education Agency
Texas Gateway: Analyzing Two Dimensional Motion
Given descriptions, illustrations, graphs, charts, or equations, students will analyze motion in two dimensions, including projectile and circular motion.
Texas Education Agency
Texas Gateway: Analyze Graphical Sources: Practice 2 (English I Reading)
Analyze the factual, quantitative, and technical data in graphs and charts.
PBS
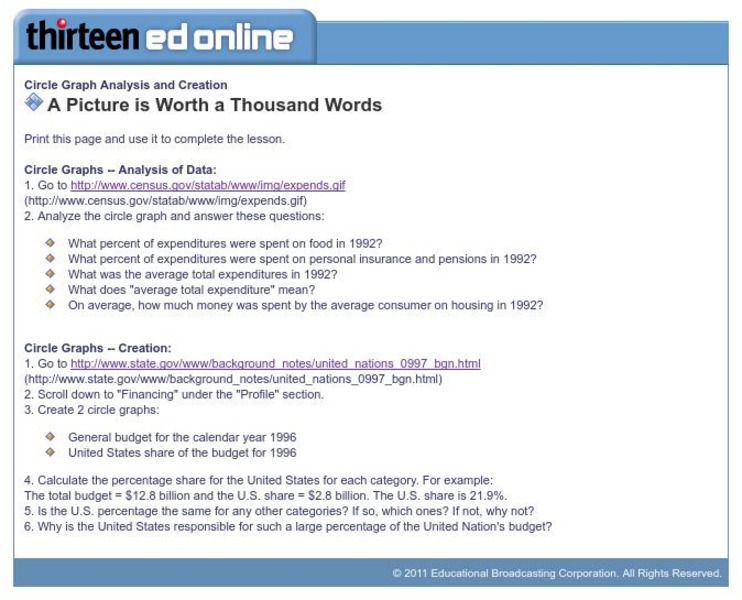
Wnet: Thirteen: Circle Graph Analysis and Creation
This site, which is provided for by WNET, gives a great way to practice using circle graphs through these exercises. One is analyzing a pie graph from the Census Bureau and the other creating pie charts using government data.
Council for Economic Education
Econ Ed Link: The Economics of Homebuying
This instructional activity analyzes the costs and benefits of homeownership and asks the student to describe the factors that affect affordability, use cost-benefit analysis and knowledge of home-buying procedures to reduce the costs,...
BBC
Bbc Bitesize: Spreadsheets
Spreadsheets are used to store information and data. Once we have our information in a spreadsheet we can run powerful calculations, make graphs and charts and analyse patterns.
Sophia Learning
Sophia: Using Graphs to Analyze Data
This lesson will demonstrate how to analyze and interpret data given in the form of a graph.
United Nations
Unesco: Math Games (In Arabic)
This site offers games and lessons that teach basic math concepts such as area and volume, number patterns, time, etc. Games use familiar tasks such as shopping to reinforce math concepts. While the title of each page includes an English...
PBS
Pbs Mathline Lesson Plan: Struts'n Stuff [Pdf]
Incorporating concepts in algebra, number sense, patterning, data collection, and geometry, this lesson engages students in various hands-on activities to explore the relationship between regular polygons and the number of diagonals...


