Curated OER
Kansas State Map
In this map of Kansas activity, students color and label major cities and physical features of this state. Students also study the location of Kansas in relation to the other states in the U.S. by studying the background map.
Curated OER
Tennessee State Map
For this Tennessee state geography worksheet, students color and label major cities and physical features on the map. Students also study a second map of the U.S. that shows the location of the state of Tennessee.
Curated OER
Utah State Map
In this geography of Utah worksheet, students color and label a map of the state of Utah. Students also study a second map that shows the location of this state in the U.S.
Curated OER
Indiana State Map
For this Indiana state map worksheet, students color and label the important cities and physical features on this outline map. Students also learn of Indiana's location in the U.S. by studying the background map.
Curated OER
Idaho State Map
In this Idaho state map worksheet, students color and label important physical features and cities. Students also study the background map to learn the location of Idaho as related to the rest of the U.S.
Curated OER
South Carolina State Map
In this map of South Carolina learning exercise, students color and label major cities and physical features in South Carolina. There is also a map showing the location of the state in the U.S.
Curated OER
Exploring a Map of Canada
In this exploring a map of Canada activity, students find and label the capital city, bodies of water, the U.S., the provinces and the territories of Canada.
ProCon
Electoral College
The Electoral College's role in elections is sometimes confusing and controversial. Pupils use a debate topics website to research the pros and cons of the practice to debate whether the United States should still use the Electoral...
Curated OER
Rhode Island State Map
In this geography of Rhode Island worksheet, students color and label a map with the major cities and physical features. Students also study a U.S. map to learn the location of the state of Rhode Island.
Curated OER
North American Biomes
In this Science worksheet, students color a biome map of North America. Students color the map by solving the clues listed on a separate sheet of paper.
US Apple Association
Apples: A Class Act! (Grades 4–6)
Middle schoolers have a bushel of fun as they engage in activities and research core facts about apples. Packed with suggestions for in-class activities and out-of-class research, the colorful 6-page packet is sure to satisfy hungry...
Curated OER
Biome Map
For this biomes worksheet, learners color the map of North America according to the biome clues. Students then answer questions about the North American biomes.
Curriculum Corner
Earth Day Book
This Earth Day, celebrate our beautiful planet with an activity book that challenges scholars to show off their map skills, complete a crossword puzzle, write acrostic poems, alphabetize, and reflect on their personal Earth-friendly habits.
Curated OER
Settlements in Belfast
For this Belfast geography worksheet, students arrange the names of places in order by size, color a map, match important dates and events, and write a plan for redeveloping Laganside.
Center for Innovation
Air Pollution: What's the Solution?
In this air pollution worksheet, students collect data for their county of residence as well as 10 surrounding counties including the total population and the county grade for the air. They use a map of their state and identify the 10...
Curated OER
Plotting Earthquakes
In this earthquakes worksheet, students access a website to gather information about the magnitude and location of earthquakes for 5 days. Then students complete 7 short answer questions.
Johns Hopkins University
John Hopkins University: Color Landform Atlas of the u.s.
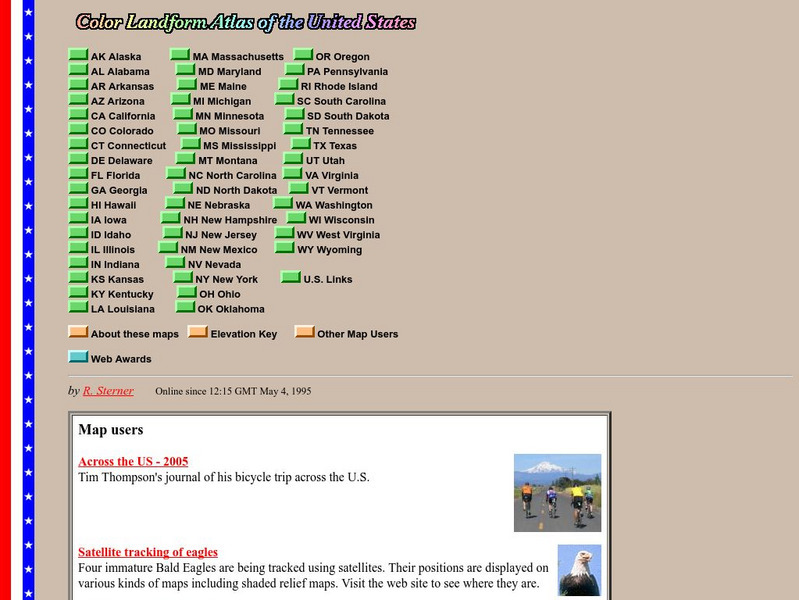
This site from John Hopkins University provides detailed maps of and physical information on each of the 50 states. Maps range from relief maps to satellite images, to historical maps.
National Council of Teachers of Mathematics
Nctm: Illuminations: State Data Map
Data can be displayed in a variety of ways. This interactive map of the United States shows data by degrees of color. Choose to display data such as: land area, population, population density, gas use, and much more.


