Curated OER
Graphing Activity
In this probability and statistics worksheet, students work with a family member to construct graphs based on real life data. The two page worksheet contains three questions. Answers are not included.
Curated OER
Two-factor ANOVA
In this statistics and probability learning exercise, students analyze the variance (ANOVA) to determine if two or more samples have the same "mean" or average. The one page learning exercise contains three problems. Answers are provided.
Curated OER
Pwerball Problem
In this statistics and probability activity, students consider the problem of lowering the odds of the Powerball lottery by determining the range of the white balls and the powerball. The one page activity contains one problem with...
Curated OER
Working with Frequency Tables
In this Working with Frequency Tables worksheet, students analyze data that is organized in simple frequency charts. They calculate average from data presented in a frequency table, calculate a cumulative score, and identify data that...
Curated OER
A Ststistical Study on the Letters of the Alphabet
In this Statistics and Probability worksheet, students create a line plot for the first 100 letters in the Preamble to the constitution and compare their frequency distributions to the actual frequency distribution. The one page...
Curated OER
Math Applications
In this math applications worksheet, students solve one word problem that has two parts to it. First, they determine the expected value of a ticket for a prize. Then, student determine the fair price for the ticket purchased and explain...
Shmoop
Box, Stem-Leaf, and Histogram
A helpful and versatile instructional activity requires young mathematicians to analyze data in order to create graphs and answer questions. Additionally, it prompts learners to find the mean, median, mode, and range of some of the data...
Curated OER
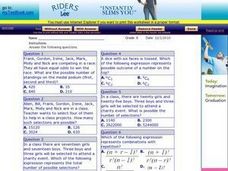
Combinations & Permutations
In this combination and permutations activity, students identify possible outcomes. They determine if the given situation is a combination or permutation and solve accordingly. This one-page activity contains 10 multiple choice...
Virginia Department of Education
Scatterplots
Math is all fun and games with this activity! Learners use an activity designed around hula hoops to collect data. They create scatter plots with their data and then analyze the graphs for correlation.
EngageNY
End-of-Module Assessment Task: Grade 7 Mathematics Module 5
Show learners how to use simulations and random sampling to reach conclusions with the last resource in a 25-part series. The assessment contains three scenarios, each with several parts, and covers comparing populations using random...
Virginia Department of Education
Graphs
Examine different types of graphs as a means for analyzing data. Math scholars identify the type of graph from a series of data displays and then develop questions to match each one. Then, given a scatter plot of height versus age data,...
Happy Maau Studios
Math Ref
Forgot how to multiply matrices? Well, this app can help. It is like a gigantic, well-organized reference card for all things math. Customize your personal reference material by adding your own notes and build up a personalized list of...
Education Development Center
Choosing Samples
What makes a good sample? Your classes collaborate to answer this question through a task involving areas of rectangles. Given a set of 100 rectangles, they sample a set of five rectangles to estimate the average area of the figures. The...
Curated OER
Drug Sales Soar: Bar Graph
For this graphs worksheet, students analyze a bar graph that shows retail prescription drug sales in the U.S. Students complete five problem solving questions about the data on the graph.
Curated OER
English Vocabulary Skills: AWL Sublist 8 - Exercise 3c
In this online interactive English vocabulary skills worksheet, students answer 10 matching questions which require them to fill in the blanks in 10 sentences. Students may submit their answers to be scored.
Curated OER
The Nature of Mathematics
In this nature of mathematics worksheet, students identify the different aspects of mathematics and how simple mathematical models are constructed to solve problems. Then, they define the power and limitations of mathematical analysis....
Curated OER
Line graphs
In this line graphs instructional activity, learners read 2 line graphs and answer short answer questions about them. Students answer 5 questions for each graph.
Curated OER
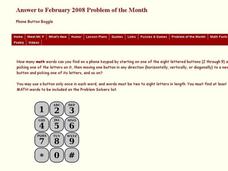
Phone Button Boggle
In this phone button boggle activity, learners identify the number of math words they can find on a phone keypad according to given directions. This one-page activity contains one problem. Answers are provided.
Curated OER
Math is Everywhere! Post Test
In this math test activity, students complete 10 multiple choice questions covering a wide variety of math concepts. An answer link is included.
Curated OER
The Dark Side of Family Life
In this family life worksheet, students answer seventeen questions about problems such as domestic violence by constructing short and extended response answers.
Curated OER
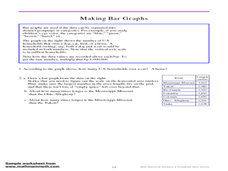
Making Bar Graphs
In this bar graph learning exercise, students answer short answer questions about bar graphs. Students answer 1 question about a bar graph about a cat, and 3 questions about a bar graph about U.S. rivers.
Curated OER
Mean, Mode and Bar Graphs
In this mean, mode and bar graphs learning exercise, 5th graders analyze the data given, then answer three questions about a bar graph and the data shown.
Curated OER
Using mean, median, and mode
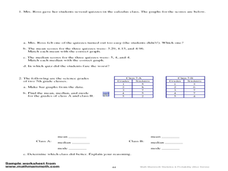
In this mean, median, and mode activity, students read how to use each method and then complete problems using each one. Students complete 8 problems.


