CK-12 Foundation
Frequency Tables to Organize and Display Data: Favorite Films
What information can your class determine if they know the number of people attending movie showings? Using the information about the number of people at each screening, learners develop a frequency table. The pupils analyze the type of...
PBL Pathways
College Costs 2
What is the financial benefit for attending a community college for the first two years before transferring to a four-year college? The second part of the educational lesson asks young scholars to explore this question through data...
American Statistical Association
Colors Challenge!
Does writing the name of a color in a different colored ink affect one's ability to read it? Scholars design an experiment to answer this question. They collect the data, analyze the statistics, and draw a conclusion based on...
Curated OER
Quantitative Data
In this quantitative data worksheet, pupils compute measures of central tendency, draw vertical line diagrams, and compare collected data. This 23-page worksheet contains approximately 100 multi-step problems. Explanations and examples...
University of Georgia
Freezing and Melting of Water
Examine the behavior of energy as water freezes and melts. An engaging activity provides a hands-on experience to learners. Collaborative groups collect data and analyze the graphs of the temperature of water as it freezes and then...
Virginia Department of Education
Graphs
Examine different types of graphs as a means for analyzing data. Math scholars identify the type of graph from a series of data displays and then develop questions to match each one. Then, given a scatter plot of height versus age...
Curated OER
Lesson Plan Outline for Rainbow Science
Young scientists study light reflection and refraction as they determine the critical angle, the rainbow angle, and color separation in rainbows. Teams record the data they collect in a shared spreadsheet and discuss results with the class.
Statistics Education Web
Consuming Cola
Caffeine affects your heart rate — or does it? Learners study experimental design while conducting their own experiment. They collect heart rate data after drinking a caffeinated beverage, create a box plot, and draw conclusions....
Willow Tree
Histograms and Venn Diagrams
There are many different options for graphing data, which can be overwhelming even for experienced mathematcians. This time, the focus is on histograms and Venn diagrams that highlight the frequency of a range of data and overlap of...
Curated OER
Choose an Appropriate Graph
In this graphs worksheet, students solve 6 fill in the blank problems where they choose the most appropriate type of graph for each set of data and explain why they chose that type. Students use bar graphs, histograms and circle graphs....
Lane Community College
Review Sheets: Beginning Algebra
This jumbo worksheet contains everything you need to get through Pre-Algebra. Begin with simple expressions, and end with linear functions and polygons. There are multiple problems for each topic to make sure those skills are set.
Dominic Szablewski
Z-Type Concepts: Typing, Basic Computer Skills, Keyboarding
Your students will be typing faster than you in no time with the help of this fun game. Similar to the classic Atari game Space Invaders, students must type words to prevent space ships from attacking as they move from the top of the...
Curated OER
Line and Double Line Graphs: Reteach
In this graphing worksheet, students review the five steps for making a double line graph to display data. Students then use the graph they made following the shapes to answer the three questions.
Beauty and Joy of Computing
Nesting Lists
Create lists within lists. The second lab in a series of five in the unit has pupils develop a simple contact list app. The tasks within the lab build the need for an abstract data type. Individuals build more complexity into their...
Weather Bug
WeatherBug
Exploring the weather has never been more intriguing! Whether you are looking for a quick glance at the 10-day forecast, trying to figure out if lightning is heading your way, or wondering what the pollen count is, you will find out...
Curated OER
Solubility Lab
In this solubility worksheet, students test a variety of polar and non polar substances to determine which ones will dissolve in vegetable oil and which ones will dissolve in water. Students collect data and answer 2 questions about...
Curated OER
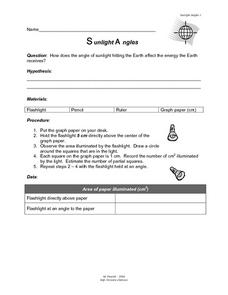
Sunlight Angles
In this sunlight learning exercise, students solve the problem of how much energy the Earth receives from the different angles of the sun. Students collect data, chart it, and come up with a conclusion.
Curated OER
Glenbrook South High School Science Scoring Rubric: Student Laboratory Reports
Here is an unexpected, but practical resource. It is not a activity, but rather an outline of what a science laboratory participant should include in a report. Especially valuable is a grading rubric that spells out what is expected for...
Curated OER
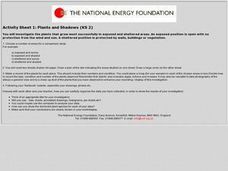
Plants and Shadows
In this science worksheet, students design an experiment to measure the effects of sunlight exposure upon plants while comparing the amount of shade as a correlation.
Texas Education Agency
Texas Gateway: Selecting and Using Representations for Collected Data
[Accessible by TX Educators. Free Registration/Login Required] Given a variety of data (including line plots, line graphs, stem and leaf plots, circle graphs, bar graphs, box and whisker plots, histograms, and Venn diagrams), the student...
National Science Foundation
National Science Foundation: State Support for Higher Education Per Full Time Equivalent Student
The interactive map on this page displays the amount spent by each states on public universities, excluding special purpose appropriations. The statistics are searchable by state for each year between 2000 and 2020. Data is also...


