Tech Know Teaching
6th Grade Constructed Response Question
Graphs, charts, maps, diagrams. Reading and comprehending informational text is far more than just decoding the words on a page. Here's a packet that provides young readers with practice answering constructed response questions using...
Curated OER
2002 U.S. National Chemistry Olympiad National Exam - Part I
As to be expected from the American Chemical Society Olympiad Examinations Task Force, this 60-question test tops the charts in terms of excellence. It consists entirely of multiple choice questions designed to assess a year's worth of...
K12 Reader
Displaying Data
It's important to learn how to display data to make the information easier for people to understand. A reading activity prompts kids to use context clues to answer five comprehension questions after reading several paragraphs about...
Curated OER
Presentation of Quantitative Data- Vertical Line Diagrams
For this quantitative data worksheet, students examine how vertical line diagrams can be used to display discrete quantitative data. They read about the use of tally charts to create vertical line graphs that display the data. They...
Curated OER
Louisiana Voices Venn Diagrams
In this graphic organizer worksheet, students follow the step-by-step directions in order to use a Venn diagram to compare and contrast two topics.
Tutorials Point India Private
E-Commerce Tutorial
How does electronic commerce benefit organizations, customers, and society? Scholars read about e-commerce as it applies to modern business practices in an informative tutorial. Pupils also discover different types of business...
Film Education
The Jungle Book
Accompany a viewing of Disney's live-action feature film, The Jungle Book, with a packet equipped with several activities focused on story elements. Scholars discuss and complete diagrams and charts about the movie's characters, setting,...
Curated OER
Reading a Science Textbook
In this skill worksheet, students get ideas about how to read a science textbook for understanding. They practice reading two paragraphs and identifying key terms and phrases.
Curated OER
Constant Net Force
In this forces worksheet, students calculate life force, acceleration, and displacement for 8 word problems. Students must label force diagram and a summation force model.
Curated OER
Informational Reading: Electronics Are Made from Resources
For this comprehension worksheet, learners read about the making of a computer: circuit boards, hard drives, monitors and plastic housings. Students then answer 3 multiples choice questions.
Mark Twain Media
Understanding Informational Text Features
Everything you need to know about informational text features can be found in this resource. Recognizing these types of text features and how they are used in text allows readers to better understand information. Teachers...
Curated OER
Thinking About Technology: What Is It? How Can It Help Us?
What is technology and how can it help us? Using a worksheet, students read a list and choose practical applications of scientific knowledge, brainstorm examples of home, school and hospital technology, graph answers in a pie chart, and...
Advocates for Human Rights
Undocumented Immigrants
Stay or go? As part of a study of immigration and human rights, class members listen to the stories of several immigrants and must decide if the story was their own if they would stay in the United States as an undocumented...
Curated OER
Plentiful Plants Book Review
In this literature learning exercise, students choose a nonfiction book about plants to read and report about. They note the title, author, illustrator, and publisher. They follow five directions to draw and label plant diagrams, make...
Curated OER
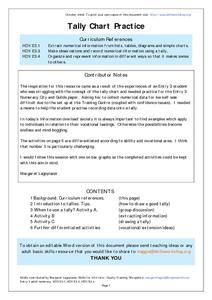
Tally Chart Practice
In this tally chart instructional activity, students will read about tally charts and their uses. Students will make a list of when and why they could make a tally chart. Next students will complete a tally chart and write statements...
Curated OER
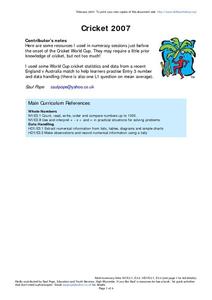
Cricket 2007
In this math and sports worksheet, students read and review the statistics from the performance of teams in the Cricket World Cup. They identify which team played the most matches and who won the most. Students also compare the...
Curated OER
Pond Theme Unit
In this pond theme activity students research facts on pond life. Students complete comprehension questions, crosswords, word search, and math puzzles. Students write a short report.
Curated OER
Counting and Calculating
In this math worksheet, students follow the basic activities that are shown in the planning guide written for the teacher. The plan is written in the form of a unit.
Curated OER
Technology has a Solution!
In this technology instructional activity, students summarize four things they learned about technology and the environment. Students then write a report that outlines how technology is solving environmental issues.
Curated OER
A Look at the Life That Electronics Lead
In this comprehension worksheet, students fill in ways on a graphic organizer that people or companies can conserve energy, reduce waste or minimize the impact to the environment. Next, students solve 3 "environmental" math word problems.
Grammarly
Grammarly Handbook: Visuals: Graphs, Charts, and Diagrams
This article explains that graphs, charts, and diagrams are used to display information visually. The choice of what type of graph or chart to use depends on the information to be displayed. Software programs make these much easier to...
CK-12 Foundation
Ck 12: Elem Math: Using Real Maps English Lengths and Distances
[Free Registration/Login may be required to access all resource tools.] The video describes how to use a map to answer questions using the lengths provided in the diagram.
Texas A&M University
Wtamu Virtual Math Lab: Beginning Algebra: Reading Graphs
A good introduction to reading bar, line, and double line graphs, and drawing and reading Venn diagrams. Contains definitions and examples of these types of charts and graphs as well as practice exercises that ask you to answer questions...
Texas Education Agency
Texas Gateway: Evaluate Graphics in Informational/procedural Text
[Accessible by TX Educators. Free Registration/Login Required] In this lesson, you will learn to explain the function of the graphical components. You will also learn to evaluate graphics on how well they do what they are intended to do.


