Illustrative Mathematics
Puppy Weights
Nobody can say no to puppies, so lets use them in math! Your learners will take puppy birth weights and organize them into different graphs. They can do a variety of different graphs and detail into the problem based on your classroom...
Mathematics Vision Project
Module 8: Modeling Data
Statistics come front and center in this unit all about analyzing discrete data. Real-world situations yield data sets that the class then uses to tease out connections and conclusions. Beginning with the basic histogram and...
Curated OER
Statistics
Seventh and eighth graders solve and complete three various types of problems. First, they find the median rate using the box-and-whisker plot shown. Then, learners describe the inter-quartile range. In addition, they determine whether...
Curated OER
Histograms
Young statisticians explore the concept of histograms. They construct histograms of various data such as change in a student's pocket, and guessing on a test. hHey analyze data represented as a histogram and a box plot and compare...
American Statistical Association
How Long is 30 Seconds?
Is time on your side? Pupils come up with an experiment to test whether their classmates can guess how long it takes for 30 seconds to elapse. They divide the class data into two groups, create box-and-whisker plots, and analyze the...
Curated OER
Introduction to Representing and Analyzing Data
Represent data graphically. Allow your class to explore different methods of representing data. They create foldables, sing songs, and play a dice game to reinforce the measures of central tendency.
Curated OER
Quartiles and Box-and-Whisker Plots
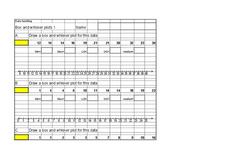
In this algebra worksheet, students identify the central tendencies as they solve a box and whisker plot graph. They identify the quartiles of the data. There are 4 questions with an answer key.
Curated OER
What is a Box and Whisker Plot?
Eighth graders explore the correct use of box and whisker plors. The times when they are appropriate to use to compare data is covered. They plot data according to statistical analysis including mean, median, and mode.
Curated OER
Steppin' Out
Students are presented with the question: "Do longer legged people run faster than shorter legged people?" Students conduct an experiment, collect their data, create box and whisker plots using a computer and graphing program, and...
Curated OER
comparison of Two Gender Sports Teams
Students gather data on sports team and create a box and whisper plot. In this data collection lesson, students find the median, the quartile range, and relationships between variables.
Curated OER
Analyzing Graphs
In this statistics and probability worksheet, students analyze frequency distribution tables or histograms and box and whisker plots. The two page worksheet contains four multiple choice questions. Answers are included.
Curated OER
Statistics
In this statistics activity, 9th graders solve and complete 10 various types of multiple choice problems. First, they determine the mean number of miles per day that were completed. Then, students determine the data set that has a median...
Curated OER
Eat Your Veggies
Students investigate displaying data. In this displaying data lesson, students use tallies to count data about food preferences. Students use various types of graphs such as bar graphs, picture graphs, box-and-whisker plots, etc to...
Curated OER
Statistics
In this statistics worksheet, students solve and complete 6 different problems that include determining various types of statistics. First, they determine the data set where the median value is equal to the mean value. Then, students use...
Curated OER
Statistics - Central Tendency
In this statistics activity, learners solve and complete 13 different problems that include creating various box-and-whisker plots. First, they write a definition for mean, median, mode and range. Then students explain how to determine...
Curated OER
Statistics
In this statistics worksheet, 9th graders solve and complete 10 various types of problems that include using different types of graphs to illustrate data. First, they determine the median score for each stem-and-leaf plot. Then, students...
Curated OER
Measures of Central Tendency
In this measures of central tendency worksheet, students solve and complete 6 different problems. First, they count the number of items in each set of data. Then, students determine the mean, median and mode for each. In addition, they...
Curated OER
Who's got the fastest legs?
Students use a stopwatch to collect information for a scatterplot. In this fastest legs lessons, students collect data through the taking of measurements, create and find a median number. Students develop an equation and answer...
Curated OER
Baseball Statistics
Students take an in depth examine baseball record breakers. They calculate statistics, not just for one year, but over whole careers, to compare some famous players and find who was the best all-time home run hitter.
Curated OER
Heart Smart in a Heart Beat
As an introductory activity, young statisticians measure their heart rate at rest and after exercise and compute the mean and median, and create a box & whisker plot. This is followed by watching a video (that no longer seems to...
Curated OER
Box and Whisker Plots
In this math learning exercise, students compute the median of sets of numbers. They create box and whisker plots. Students identify the median, upper and lower quartiles, and minimum/maximum amounts. On the last page of this learning...
Curated OER
Dealing with Data
Seventh graders collect and analyze data. In the seventh grade data analysis lesson, 7th graders explore and/or create frequency tables, multiple bar graphs, circle graphs, pictographs, histograms, line plots, stem and leaf plots, and...
Texas Instruments
Light and Day
Pupils explore the concept of collecting data as they collect data on their graphing calculator about time, temperature, and light. Learners plot the data and create histograms and box and whisker plots to analyze the data.
Curated OER
Data Management and Probability: Applications
In this data management and probability applications worksheet, 8th graders solve 20 various types of probability problems. They find the mean, median, mode and range of various numbers. Then, students use the spinner illustration to...
Other popular searches
- Box and Whisker Plots
- Box Whisker Plots
- Box and Whisker Plots
- Box & Whisker Plot
- Box and Whisker Plot Es
- Box and Whisker Plots
- Box and Whisker Plotes
- Double Box and Whisker Plots
- Box Ans Whisker Plot


