Curated OER
By Any Other Name
Students examine the differences between the definitions of race and ethnicity defined by the United States government. After reading an article, they discuss the possiblity of the elimination of some races from the 2010 census. They...
Curated OER
Drug Sales Soar: Bar Graph
For this graphs worksheet, students analyze a bar graph that shows retail prescription drug sales in the U.S. Students complete five problem solving questions about the data on the graph.
Curated OER
Celebrate Hispanic Heritage Month!
Students use information from the U.S. Bureau of the Census to create a bar graph, a picture graph, or a circle graph showing the country of origin of U.S. Hispanics.
PBS
What We Do Adds Up
With so many tons of trash going into landfills each year, your environmentalists can calculate how much the average person is tossing away. This activity has a series of questions not only requiring math, but a conscious thought of how...
Curated OER
Census Statistics and Graphing
Students graphically represent data from the Census. In this middle school mathematics lesson, students investigate the housing characteristics of different tribes of Native Americans and compare them to the average American...
Curated OER
Size It Up: Map Skills
Compare information from a US population cartogram and a standard US map. Learners draw conclusions about population density by analyzing census data a population distribution. They discover that census data is used to apportion seats in...
Curated OER
Count On Us: Concepts and Applications of Demography
Eighth graders use the Internet to research demographics of certain areas. They use the U.S. Census Bureau's website to help them gather information. They use their data to find a solution to a hypothetical problem.
Curated OER
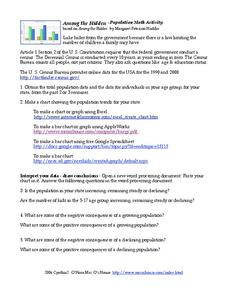
Among the Hidden - Population Math Activity
In this population worksheet, students collect data on population by researching the Census Bureau and then make online graphs and answer short answer questions about the data. Students complete 5 problems total.
Curated OER
Samples and Stats
Students explore different methods of taking surveys and conducting polls and examine these methods for bias. They design and administer a sample survey, analyze the data and present their findings to the class.
Curated OER
Where You Belong
Learners identify different groups to which they belong, and use counting techniques to take a census of their family and class.
Curated OER
Modeling Population Growth
Students investigate the reasons for taking a census and determine the problems that are involved in the process. They examine the population figure for Montana and Lake county before using the information to complete the included...
Curated OER
People On The Move
Students describe patterns of internal migration in the United States, past and present and evaluate implications of internal migration. They examine population movement at the state and local levels.
Curated OER
Kids Count
Students read special purpose map, use place value to hundred thousands, and write numbers to hundred thousands.
Curated OER
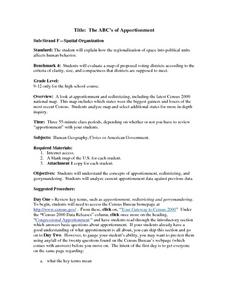
The ABC's of Apportionment
Students are introduced to the terms of apportionment and redistricting. Using a Census map, they identify the states that had the highest and lowest numbers of change during the past ten years. They examine a map of voting districts and...
Curated OER
World Statistic Day
Eleventh graders collect data about the state they live in. In this statistics lesson, 11th graders collect and analyze data as they compare themselves to students in other states. They analyze data about a person's education level, and...
Curated OER
Factors In Population Growth
High schoolers examine both historical and recent estimates of world population. They identify regions of the world that have had significant population growth in the last decade and speculate on reasons for this.
Curated OER
Immigration in Spain
How many people immigrate to Spain illegally each year? Both the United States and Spain see a lot of illegal immigration. Advanced learners will read various articles, compare and contrast the situation in both countries, and discuss...
Curated OER
What's in a Number? Analyzing Smoking Statistics
Sixth and seventh graders analyze smoking statistics. In this health lesson, learners look at the percentage of people who smoke from each race group. They create a bar graph and circle graph that displays this information.
Curated OER
How Much is There to Eat?
High schoolers examine food production related to population density. In this interdisciplinary lesson, students gather data regarding food production in the American South and in India. High schoolers follow the outlined steps to...
Curated OER
Graphs and Data
Students investigate poverty using graphs. In this algebra instructional activity, students collect data on the effects of poverty and use different rules to analyze the data. They graph and use the trapezoid rule to interpret the data.
Curated OER
Shrinking Spaces
Students describe the impact of population growth on the environment. They describe how cities affect their surrounding environment and explain how cities are handling growth and its resulting effect on the quality of life. They visit...
Center for Innovation
Air Pollution: What's the Solution?
In this air pollution worksheet, students collect data for their county of residence as well as 10 surrounding counties including the total population and the county grade for the air. They use a map of their state and identify the 10...
Curated OER
Graphically Speaking
Students discover the links between population and Congressional representation. In this government lesson, students research population statistics and create spreadsheets that compare population to the number of Congress members per state.
Curated OER
Human Population's Response to Re-emerging and Emerging Infectious Diseases
Students examine the human population response to microbial diseases. In this disease lesson students observe population trends, write about a scientist and evaluate and defend current treatments for infectious diseases.


