Curated OER
Probabilities for Number Cubes
Students explore the concept of probability. In this probability lesson, students roll a six-sided number cube and record the frequency of each outcome. Students graph their data using a frequency chart and keep tally marks in a...
Curated OER
Revolution in China And the Fall of Imperialism
Students study modern Chinese history according to the fall of the Qing Dynasty through the Communist Revolution. They explain the global impact of imperialism including political and social reform in China and complete a vocabulary...
Curated OER
A Class Census
Students recognize that data represents specific pieces of information about real-world activities, such as the census. For this census lesson, students take a class and school-wide census and construct tally charts and bar graphs to...
Curated OER
Pumped Up Gas Prices
Students calculate gas prices. In this transportation lesson, students tally the mileage and gas costs of their car for one months. They figure out how much was spent on gas and create a graph showing average gas prices over time.
Curated OER
Students Favorites
Learners complete activities using a frequency table and construct a pie graph for the data. In this frequency table lesson, students complete a survey to find data for a frequency table. Learners use the given link to make a pie graph...
Curated OER
Frequency Tables - Home Link Support
In this home school support worksheet, 2nd graders, with a home support person, review the use of frequency tables to organize and display data. They make their own frequency table and read it with the support person.
Curated OER
Survey Surfing
Students survey other students and record the information on a chart using tally marks. They record their favorite fish and their favorite foods, and share the results with the class.
Curated OER
Range and Mode
Students interpret data from graphs. In this range and mode lesson, students review a tally chart, pictograph and bar graph. Students use these graphs to calculate the range and mode of each set of data.
Curated OER
Pumpkin Seed Experiment
In this unique activity students participate in a pumpkin seed experiment. Students interact with the pumpkins weight, seeds and record their findings of what lies within the pumpkin once the top of the pumpkin is cut off for...
Curated OER
Black History: Report Planner
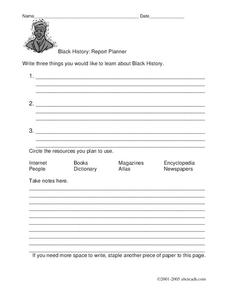
In this Black History report planner worksheet, 3rd graders will write 3 things they would like to learn about Black History and the resource they plan to use to write their report. They will begin their rough draft and complete a KWL...
Curated OER
M&M Math
Students sort a bag of M&M candies according to color using a sorting mat. They count M&M candies. They compare the number to their prediction then students create tally charts.
Curated OER
Food Groups in our Lunch
Students make a graph. In this food groups and graphing lesson, students pack a sack lunch and then work in groups to tally the number of foods from each food group that they have. Students use the data collected to create a graph using...
Curated OER
Shoeless Math
First graders sort and classify, and complete a T-chart using Students' shoes.
Curated OER
Core Democratic Values in Action
Students compare and contrast rules they have in their homes and in the classroom. In this values lesson, students identify rules at home and relate to rules of other families. They list family rules, connect classroom rules to values...
Curated OER
A Turkey for Thanksgiving - Lesson #2
Second graders investigate realistic fiction, holiday celebrations, making tally charts. In this multi-disciplinary lesson, 2nd graders listen to a story about Thanksgiving and one about the Chinese New Year to develop an understanding...
Curated OER
Animal Classifications
Third graders work in small groups to investigate how to sort a variety of items into groups and subgroups. They work on a class chart based on the activity which show how the items are classified based on commonalities. Upon completion...
Curated OER
Celebrating 100
First graders tally the number of days spent at school until they reach the number 100. They complete a variety of activities to commemorate this day and consider the importance of the number zero.
Curated OER
Mira: Activity 10
Young scholars read the story, Mira and then draw a picture of their favorite weather using the story as a background. They post their pictures around the room and make a tally chart of the number of pictures that were drawn with...
Curated OER
Graphing Regions: Lesson 2
Learners identify and analyze geographical locations of inventors. They each identify where their inventor is from on a U.S. map, discuss geographic patterns, and create a t-chart and graph using the Graph Club 2.0 Software.
Curated OER
Who Got Away? 18th Century Runaway Slaves
Students read runaway slave advertisements while completing a chart to determine whether slaves successfully escaped. In this US history lesson plan, students must research the Virginia Runaways Digital Project and use the given links to...
Curated OER
Frequency Words
First graders use a graph to answer questions about the frequency of words. Using rhymes, they fill in a chart about the data they collected. In groups, they use their word wall words to identify them in a book.
Curated OER
Working with Spreadsheets
Students integrate physical education and technology. They give their best during jogging time and keep tally of the number of laps they run during their jogging time each day. They record this on a tally sheet and enter a formula which...
Curated OER
How Many Ways?
Second graders develop number sense. In this number sense lesson, 2nd graders use multiple ways to represent numbers including written numerals, tally marks and manipulatives. Students correctly use place value to the thousands place.
Curated OER
Probability
Sixth graders explore probability. They analyze a class chart and list the letters of the alphabet according to frequency. Using the data collected, they complete probability problems.
Other popular searches
- Tally Charts
- Tally Charts and Pictographs
- Tally Charts and Tables
- Tally Charts or Pictographs.
- Math Tally Charts
- Primary Tally Charts
- Sorting and Tally Charts
- Tally Charts Mode
- Using Tally Charts
- Lucky Charms Tally Charts
- Birthday Tally Charts
- Tally Charts Lesson Plans


