Curated OER
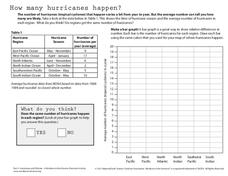
How Many Hurricanes Happen?
In this hurricanes worksheet, students use a data table showing the hurricane region and the average number of hurricanes per year to determine if the same number of hurricanes happen in each region by creating a graph. Then students...
Curated OER
Global Warming Statistics
Students research and collect data regarding temperature changes for a specific location and find the mean, median, and mode for their data. In this climate change lesson, students choose a location to research and collect data regarding...
Curated OER
Density of Pennies Lab
In this density of pennies instructional activity, student conduct an experiment to determine the metals used in the core of pennies made after 1983. Students design their own experiments using a balance and graph paper to determine the...
Curated OER
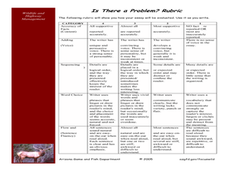
Is There a Problem with Wildlife on our Roads?
Learners create a graph and analyze it to see if the data shows there is a problem with wildlife on the roads. In this wildlife collision activity students write an essay to support their conclusions.
Curated OER
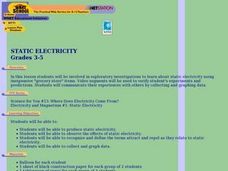
Static Electricity - Grocery Store Items
Students investigate static electricity using inexpensive "grocery store" items. They view demonstrations with video segments. They graph the data they collect.
Curated OER
Health of Aquatic Life a Real Problem
Learners explore the health of aquatic life in this science lesson They measure and track the oxygen level in the water to determine the health of the aquatic life. They collect this data using the TI explorer to graph and analyze their...
Curated OER
Take a Walk
Sixth graders graph acceleration and practice using the metric system. In this physics instructional activity, 6th graders take turns timing each other as they walk 15 meters. Students then chart and graph their data using the metric...
Curated OER
The Big Bang-Hubble's Law
In this Hubble's law worksheet, students use data for galaxies which include their distance and speed. Students make a graph to show the distance to each galaxy and the speed of each galaxy. They use their graph to answer 4 questions...
Curated OER
Away We Go!
Students study types of transportation. In this transportation lesson, students survey several classes to gather data on how they get to school. Students create a transportation graph.
Curated OER
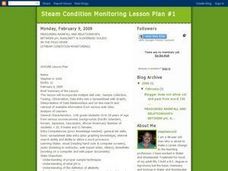
Measuring Rainfall and Relationships Between pH, Alkalinity and Suspended Solids in the Pago River
Eleventh graders test the pH and alkalinity of Pago River. In this ecology lesson, 11th graders collect data and use spreadsheet to graph results. They analyze and share their findings with the class.
Curated OER
Solar Cycle
Learners explore the solar cycle through a series of experiments. In this space science lesson, students construct and evaluate solar cycle graphs. They explain how this phenomenon affects the Earth.
Curated OER
At the Edge of the Continent
Young scholars study how to interpret a bathymetric map. They study the main features of the continental margin. They plot and graph bathymetric data. They think about and discuss the bathymetry of the edge of the cont
Curated OER
Pika Chew
Students work in collaborative teams with specific roles, use the Internet to research the behavior and ecology of pikas, make predictions about survival rates of pikas in different habitats and organize their data in graphs.
Curated OER
Asthma Survey
Students collect survey data on the prevalence of asthma in a community. They summarize and display the survey data in ways that show meaning.
Curated OER
Dinosaur Scavenger Hunt
Students conduct research on dinosaurs and graph the information gathered using a spreadsheet program. In pairs they complete an Internet scavenger hunt, and record five facts about dinosaurs in their science journal.
Curated OER
Diffusion
Students design and carry out an experiment according to the scientific method. The experiment must test the effects of time and concentration on the rate of diffusion of potassium permanganate into potato cubes. After performing the...
Curated OER
Specific Heat of Air and Soil
Students are introduced to the concept of specific heat. In groups, they are given a set of data showing the temperatures of air and soil samples in which they calculate the ranges of the data. They identify whether the air or soil...
Curated OER
Student - Designed Density Experiment and Poster
In this student-designed experiment worksheet, students decide on an experimental problem to solve. Students use the scientific method to perform an experiment and record the data. Students calculate the density of liquid used in the...
Curated OER
I'm Warm Now
Third graders graph how much water is wasted while waiting for it to get warm in the spigot in the sink. In this graphing lesson plan, student first predict how much water is wasted. That night they test it out at home and the next day...
Curated OER
Testing for Vitamin C in Different Drinks and Foods
Students examine the importance of vitamin c in their diets and the sources that it comes from. In this vitamin activity students complete hands on activities, interpret data and make a bar graph.
Curated OER
Is There Liquid Water on Mars?
Students assess whether there is liquid water on Mars by analyzing images and data. In this planetary lesson students analyze temperature and pressure graphs and hypothesize about how water could have flowed on Mars.
Curated OER
Activity Three Teacher Page: Collisions
Students after completing this lesson, identify variables that affect the system, and specify which variables are independent; which are dependent. They represent data in a data table and a graph and analyze data and make predictions.
Curated OER
Straw Breathing Exercise
High schoolers fill out an anonymous questionaire to explore whether they might have asthma. They then set up a spreadsheet to enter the data, decide on a definition of asthma, and figure out the prevalence of asthma. Pupils simulate...
Curated OER
Bean Sprout
Student will track the growth of his/her bean sprout with sunlight and without sunlight over the course of 3 weeks. They will enter the results into an excel data base then graph the results of both variables to make the comparison.


