Curated OER
US Households
Learners construct and use inverse functions to model a real-world context. They use the inverse function to interpolate a data point.
Curated OER
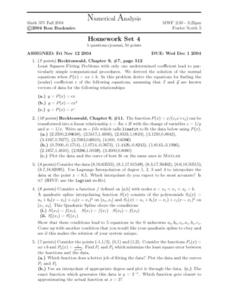
Numerical Analysis: Piecewise Polynomial Interpolation
In this interpolation worksheet, students use a linear interpolating polynomial and then describe the extrapolated value of the function. This four-page worksheet contains ten problems.
Curated OER
Numerical Analysis: Polynomial Interpolation
For this polynomial worksheet, students find interpolating functions that can be expressed as a linear combination of basis functions. This four-page worksheet contains five multi-step problems.
Curated OER
Linear Patterns in Data
Eighth graders extend their learning of graphing linear equations and are introduced to connecting patterns in tables and graphs to represent algebraic representations. They then determine patterns and extrapolate information from these...
Curated OER
Numerical Analysis: Polynomial Interpolation
In this polynomial activity, students identify the interpolated and extrapolated value of given equations. This four-page activity contains approximately ten problems. Explanations and examples are provided.
Curated OER
Investigating Linear Equations Using Graphing Calculator
Students investigate linear equations using the Ti-Calculator. In this algebra activity, students graph lines and identify the different quadrants on a coordinate plane. They identify ordered pairs used to plot lines.
Illustrative Mathematics
Households
Use an inverse linear function to interpolate a point. Presented with the number of households over a period of year, pupils find a linear function that will be a model. Class members determine the inverse of the linear function and use...
Curated OER
How Do They Relate? Linear Relationship
Young scholars collect information and use a line to represent it. In this algebra lesson, students investigate real world data to see if it makes a line. They graph the line comparing the relationship of the x axis with that of the y axis.
Curated OER
Numerical Analysis: Polynomials
For this polynomial worksheet, students explore functions, determine the least square error, and explore quadratic spline interpolation. This two-page worksheet contains approximately six problems.
Curated OER
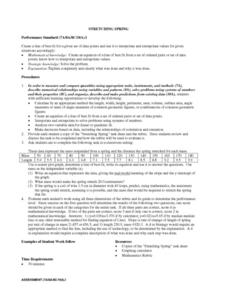
STRETCHING SPRING
Young scholars calculate the length, width, height, perimeter, area, volume, surface area, angle measures or sums of angle measures of common geometric figures. They create an equation of a line of best fit from a set of ordered...
Kenan Fellows
How Does an Unhealthy Diet Influence our Health and Well-Being?
You are what you eat, or so they say! After surveying family and friends on a week of eating habits, learners analyze the data for patterns. They compare different variables such as fats and cost, fats and calories, or fats and LDLs.
Space Awareness
Valleys Deep and Mountains High
Sometimes the best view is from the farthest distance. Satellite imaging makes it possible to create altitude maps from far above the earth. A three-part activity has your young scientists play the role of the satellite and then use...
Alabama Learning Exchange
Bloodstain Pattern Doesn't Lie......
An interesting instructional activity on hypothesizing about the diameter of a drop of blood that is splattered. To test their theories, learners work in groups to make blood droplets splatter from different heights. They use graphed...
Curated OER
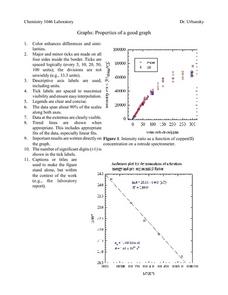
Properties of a Good Graph
In this chemistry worksheet, students examine the common characteristics of an acceptable graph that is meant to be used to display data.
Curated OER
Birds' Eggs
More than just data, scatter plots are full of information that can be used to answer a variety of questions. This lesson uses a plot with information about bird egg sizes to answer questions about the relationship between length and...
Curated OER
How Alike Are We?
Fourth graders find the range, mode, median, and mean for each of the data sets (height and shoe size). They discuss which measure of central tendency for each data set best represents the class and why. Students graph the shoe size and...
Curated OER
A Special Relationship
Students discover the relationships of the lengths of the sides of right triangles and right triangles using a series of drawings on dot paper. They investigate and solve problems of standard (customary and metric units) and non-standard...
Curated OER
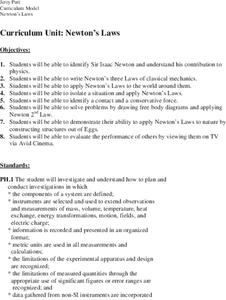
Newton's Laws
Students examine and discuss Newton's Laws and discover his contribution to physics. In groups, they participate in an experiment in which they much apply the Laws to the world around them. They describe contact and conservative forces...
Curated OER
PLANETS IN PROPORTION
Students discover scales for both the solar bodies' relative sizes and their distances from the sun. They find equatorial circumference and volumes of their solar bodies. Students apply estimation strategies and proportioanl reasoning to...
Curated OER
Numerical Analysis: Worksheet 12: Comparing Root-Finding Methods
In this root-finding worksheet, students rank numbers in asymptotic order. They identify and discuss the roots of the original function. This four-page worksheet contains approximately 10 problems.
Curated OER
Lining Up Data
High schoolers examine the concept of function and make models of data and predictions based on that data.
Curated OER
Perimeters, Patterns, and Conjectures
Students discover patterns and write conjectures relating to perimeters and polygons. Working in cooperative learning groups, they use manipulatives and graphic organizers to solve problems then answer a series of questions in which they...


