Curated OER
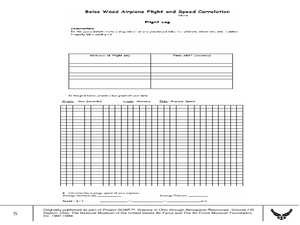
Balsa Wood Airplane Flight and Speed Correlation
Ninth graders calculate the average speed of their balsa wood airplane. In this physics lesson, 9th graders build their own airplane and make necessary modifications to to make it fly straight. They interpret distance and time graph...
Curated OER
More Bait for Your Buck!
Learners determine where to buy the heaviest earthworms as they study invertebrates. They create a double bar graph of the results of the weight data.
Curated OER
Transportation Through Time
Third graders measure the speed at which they can walk in order to understand speed and distance traveled. They then research the history of transportation and express data in a class timeline.
Curated OER
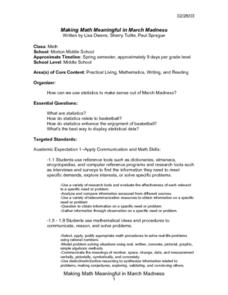
Making Math Meaningful in March Madness
Students examine the statistics of March Madness, the college basketball tournament. They watch videotaped basketball games to collect data for further analysis using Word and Excel. They analyze the data in a variety of activities...
Curated OER
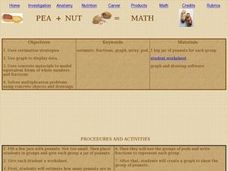
Pea+Nut = Math
Students utilize peanuts to practice fractions. In this math model lesson, students solve multiplication problems and fractions with real peanuts. Students use drawing software to graph data from the math equations.
Curated OER
Candy Experiment
Students investigate why a slope is negative. In this algebra lesson plan, students differentiate between negative and positive slopes by graphing. They collect data, write an equation and graph using the slope.
Curated OER
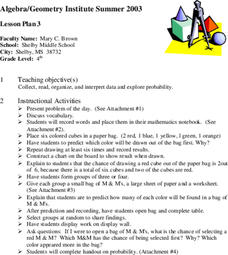
Exploring Probability
Fourth graders participate in a lesson that explores probability. They use candy and model cubes to experiment with different outcomes that can be charted if the students can proceed to the objective of the lesson. They discover how...
Curated OER
Spyglass
Students distinguish between visualization and scientific visualization. They use the software program Spygalss to create images from two-dimensional arrays of numbers.
Curated OER
Math Made Easy
Students evaluate word problems. In this problem solving lesson, students are presented with word problems requiring graphing skills and students work independently to solve.
Curated OER
Environmental Graphing
Students experiment with graphing. In this graphing introduction lesson, students complete four activities: 1) a bar graph based on class birthdays 2) an estimation graph of the raisins in raisin bread 3) another estimation example with...
Curated OER
Skittles® in the Middle
Fourth graders work in small groups, using bags of Skittles?? to determine the mean of one color of Skittles?? found in each bag, in each group, and in the entire class. This is a good lesson to help motivate students to explore mode,...
Curated OER
Successful Resource-based Learning Strategies for the Geography of Canada Course
Students conduct a statistical research project on population changes. They evaluate demographic issues, such as the size and location of native people. immigrant groups, and the age and gender of the population.
Curated OER
Measuring the Effect of Adrenaline on the Heart Rate of Zebra Fish
Students investigate the heart beat of zebra fish in timed intervals. They record the heart beats and average three counts to display in their data tables. They repeat these steps increasing the adrenaline solution.
Curated OER
3 Kinds of Graphs
Students construct three different graphs-a line graph, a bar graph, and a circle graph. In this graphing lesson, students use different graphs to display various data that they collect.
Curated OER
Bouncing off the Walls
Third graders compare the bouncing height of different types of balls. In this science lesson, 3rd graders explain the importance of repeated experimentation in science. They record their result and share them with the class.
Curated OER
Room Temperature Investigation
While the topic of this investigation is not specific to any particular discipline of science, it does serve as a practice of the scientific method. Learners set up a bowl containing boiling water, one with room temperature water, and...
South Penquite Farms
Measuring Soil Temperatures
Using an auger, start-up soil scientists bore a core of soil. They examine the sample and record the temperature at three depths in the borehole. This is an attractive activity sheet that succinctly guides your earth science class...
Curated OER
Graphing Current Drug Data
Learners increase understanding of the drug issue and further develop skill in graphing.
Curated OER
Range and Mode
Students interpret data from graphs. In this range and mode lesson, students review a tally chart, pictograph and bar graph. Students use these graphs to calculate the range and mode of each set of data.
Curated OER
Cold Enough?
Young scholars read and record temperatures and display the data. They represent the temperatures on an appropriate graph and explain completely what was done and why it was done. Students display the data showing differences in the...
Curated OER
Critter Museum
Students act as directors of a new science museum where they have decided to set up a display of animals without backbones that are found in the area. To organize their display, they need to sort and classify a collection of animals and...
Curated OER
Using Computers to Produce Spreadsheets and Bar Graphs
Students review graphing terminology and how to plot data points, how to input data into a spreadsheet, and how to make a chart using a computer.
Curated OER
GPS Art
Young scholars design their own logo or picture and use a handheld GPS receiver to map it out. They write out a word or graphic on a field or playground, walk the path, and log GPS data. The results display their "art" on their GPS...
Curated OER
Friction Force
Students investigate friction force on a variety of objects such as bricks and cardboard boxes. They use a force probe to collect data on the changes in force required to drag the objects across a variety of surface types.
Other popular searches
- Data Display
- Misleading Data Display
- Appropriate Data Display
- Graphs and Data Display
- Data Display Center
- Voluntary Data Display
- Best Data Display
- Data Display and Analysis
- Rates and Data Display
- Simulation Data Display
- Ways to Display Data
- And Display Simple Data


