Curated OER
A Picture is Worth a Thousand Words
Pupils create various types of graphs. They go to suggested websites to collect data and create graphs to organize the data. Then they answer questions according to their graph.
Curated OER
The Hope to Cope: Coping Skills
Explore how to weigh the value of positive and negative coping skills in life situations with middle schoolers. They will be able to recognize the coping skills that they have used that been negative ways of coping with stress and look...
Curated OER
NUMB3RS - Season 2 - "Convergence" - Air Hockey
Learn how to use a matrix to organize data to solve a problem. This activity uses wins and losses to rank players for an air hockey tournament they wish to have. After practicing some basic matrix operations the class could do the...
National Wildlife Federation
Quantifying Land Changes Over Time Using Landsat
"Humans have become a geologic agent comparable to erosion and [volcanic] eruptions ..." Paul J. Crutzen, a Nobel Prize-winning atmospheric chemist. Using Landsat imagery, scholars create a grid showing land use type, such as urban,...
Curated OER
Managing Wildlife
Students discuss the current conditions of wildlife in New England. Students explore how animals are tracked and how their population is managed.
Curated OER
A Comparison Study of Water Vapor Data to Precipitation over North America
Students use NASA satellite data to compare water vapor over the United States. In this data analysis lesson students use an Excel spreadsheet to map their data.
Curated OER
Water Balance & Nitrogenous Waste Removal
Examine the structures of the kidney and then define the functions of the specialised structures. Every will find this powerpoint engaging, many of the images will present facts such as osmolarity of interstitial fluid and the negative...
Curated OER
Time Management
Students are taken through the design process to develop a system of time management for themselves and others. They practice participating in a critique of other students' time schedules and modify and improve their initial time...
Curated OER
Obstacles to Success: Misleading Data
Eleventh graders explore how data reported by country agencies can mislead the public intentionally or unintentionally. In this Cross Curricular activity, 11th graders analyze charts and graphs in order to draw conclusions. Students...
Curated OER
Excel Turns Data Into Information
Students use excel to analyze data. In this technology lesson, students enter data into the excel program to find averages and organize data.
Curated OER
Management of Wildlife Resources
Students investigate how wildlife management policies affect the size of large animal populations. They develop a spreadsheet that incorporates a mathematical model to predict big game herd sizes, and using worksheet data manage a bison...
Bowland
Fashionista
So trendy! Show your class how to identify trends in sales patterns using mathematics. Scholars use a software simulation to collect data on age groups, price, and sales at a fashion store. This data allows individuals to determine the...
Virginia Department of Education
Calculating Measures of Dispersion
Double the fun — calculate two measures of deviation. The lesson plan provides information to lead the class through the process of calculating the mean absolute deviation and the standard deviation of a data set. After learning how to...
Rice University
Introductory Statistics
Statistically speaking, the content covers several grades. Featuring all of the statistics typically covered in a college-level Statistics course, the expansive content spans from sixth grade on up to high school. Material comes from a...
Tennessee Valley Authority
Renewable Energy Sources
Not all energy sources are renewable, as learners investigate in this unit. Made up of six lessons that span a few weeks of instruction, the unit has learners examining US energy reserves and consumption, using data to draw conclusions...
Curated OER
Wildlife and Highway Management
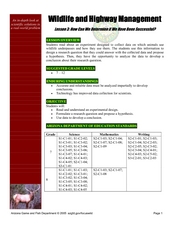
Pupils create a research questions about animal underpasses and how animals use them. In this animals lesson plan, students use their collected data to answer their question.
Curated OER
Digger and the Gang
Help online friends Digger and Sprat from the BBC series to solve math problems! In a series of activities, your class will use data sets to calculate measurements, averages, means, and probabilities. The class completes worksheets and...
Curated OER
Destressing: Don't Sweat the Small Stuff
Students interview peers, teachers, counselors, parents and local health providers to see how they identify "good" stress and suggest teens cope, write news feature about stress, complete with extra boxes, such as list of signs to spots,...
Curated OER
My time to Shine!
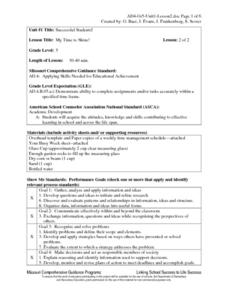
Fifth graders identify and acquire the attitudes, knowledge, and skills that contribute to effective learning in school and across the life span. Then they identify and practice through an experiment, time management skills and why it is...
Curated OER
Mean, Median and Mode
Young statisians work with sets of data. They find mean, median and mode, and discuss the effects of outliers on the data set.
Curated OER
Fire Wars
Your class can practice collecting and analyzing data. They extrapolate information and derive data from fire season statistics. They also choose the most appropriate format to display collected data.
Curated OER
Mean, Median, Mode, Range
Learners engage in a study of mean, median, mode, and range in order to represent data in tables. They are also exposed to the results of data that is skewed because of the outlier.
Curated OER
Can You Count on Cans?
How can a canned food drive be connected to math? It's as simple as counting and organizing the cans! Children demonstrate their ability to sort non-perishable foods into categories that include soup cans, vegetable cans, boxed items,...
Curated OER
Coming to Know F and C
Students collect temperatures using a probe and examine data. In this temperature instructional activity students complete an activity using a graphing calculator.
Other popular searches
- Measurement Data Management
- Data Management Story
- Math and Data Management
- Math Lesson Data Management
- Data Management and Graphing
- Data Management Computing
- Data Management Analysis
- Data Management Math
- Data Management Lesson Plan
- Data Management Math Lessons
- Data Base Management Systems
- Business Data Management


