Alabama Learning Exchange
Ice Cream Sundae Survey
Young scholars analyze data through graphs. They will complete a class survey on ice cream sundaes and tally and graph the responses. They then analyze the information from the class graph.
EngageNY
Summarizing Bivariate Categorical Data in a Two-Way Table
Be sure to look both ways when making a two-way table. In the lesson, scholars learn to create two-way tables to display bivariate data. They calculate relative frequencies to answer questions of interest in the 14th part of the series.
Curated OER
Collect and Organize Data
In this data analysis worksheet, 4th graders use a tally chart about favorite television programs. They record which are least or most popular, rankings, and combinations of programs.
Curated OER
Favorite Days
Students collect and organize data about themselves. In this data analysis lesson, students discuss their favorite calendar dates and explore ways to display the data.
Curated OER
NUMB3RS - Season 2 - "Convergence" - Air Hockey
Learn how to use a matrix to organize data to solve a problem. This activity uses wins and losses to rank players for an air hockey tournament they wish to have. After practicing some basic matrix operations the class could do the...
Curated OER
"Data Dabble"
Young scholars engage in a lesson which facilitates their use of web sites to find data, graph it, and interpret it, thus scaffolding graphing skills to prepare students for their 8th grade I-search exit project.
Curated OER
Can You Count on Cans?
How can a canned food drive be connected to math? It's as simple as counting and organizing the cans! Children demonstrate their ability to sort non-perishable foods into categories that include soup cans, vegetable cans, boxed items,...
Curated OER
Collect and Organize Data: Reteach
In this data collection worksheet, students learn the parts of a tally chart and how it organizes information. Students then use the second tally chart to help them answer the six questions.
Curated OER
Student Costs Data Table
Young scholars compare and contrast two routes selected for a virtual field trip. They create a data table of educational activities, lodging, and meal costs using Microsoft Excel software.
Curated OER
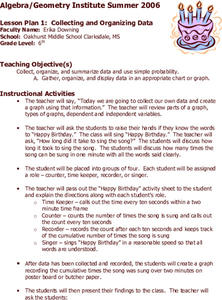
Collecting and Organizing Data
Sixth graders practice collecting and organizing data. In groups, 6th graders determine how many times "Happy Birthday" (at a reasonable rate) may be sung in ten seconds. They collect the information and create a graph.
Curated OER
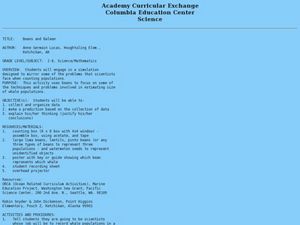
Beans and Baleen
Predict whale populations using different beans as whales! Learners observe different types of beans in a dish knowing that each bean represents a different kind of whale. They then predict how many "whales" there are in a certain area....
Curated OER
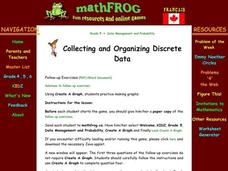
Collecting and Organizing Data
Fifth graders explore methods of generating and organizing data. Afterward, they visit a specified website where they analyze data, organize, and create graphs. Students follow instructions and complete answers to questions. They...
Curated OER
Building Brilliant Bar Graphs
Everything you need for a mini-unit on bar graphs is included in this lesson plan! It outlines three lessons and includes worksheets. Learners taste pretzels, shoot baskets (switching off hands), and grab candy, graphing results...
Curated OER
Data, Data, Everywhere... and What Am I To Think?
Students demonstrate good random sampling techniques for data collection, select and develop graphic presentations of data and analyze the data to solve a problem presented.
Curated OER
What's Data?
Learners get the opportunity to investigate the concept of data collecting. They explore how to tally and read a bar graph. Vocabulary about data is also be included. At the end of the lesson, individual students collect data independently.
Curated OER
Accidents Happen: Seat Belt Laws, Enforcement, and Usage
Start with a NOVA video about car crashes, crash test dummy footage, or other video about seat belt use. Or have groups review attached data about seat belt usage (by state) and share their conclusions. Learners then devise a method to...
Curated OER
Exploring Data Sets and Statistics in Baseball
Students explore the concept data sets. In this data sets activity, students find the 5 number summaries for salaries of teachers and compare them with 5 number summaries of professional baseball players. Students use box and whisker...
American Statistical Association
Don't Spill the Beans!
Become a bean counter. Pupils use a fun activity to design and execute an experiment to determine whether they can grab more beans with their dominant hand or non-dominant hand. They use the class data to create scatter plots and then...
Willow Tree
Line Plots
You can't see patterns in a jumble of numbers ... so organize them! Learners take a set of data and use a line plot to organize the numbers. From the line plot, they find minimum, maximum, mean, and make other conclusions about the data.
National Council of Teachers of Mathematics
Eruptions: Old Faithful Geyser
How long do we have to wait? Given several days of times between eruptions of Old Faithful, learners create a graphical representation for two days. Groups combine their data to determine an appropriate wait time between eruptions.
Curated OER
Comparing Data on Graph A and Graph B
Second graders gather and graph data. In this graphing lesson, 2nd graders collect data and graph this information using tally charts, bar graphs, pictographs, or tables. They make predictions about the outcomes.
Curated OER
Data! Data! Graph that Data!
Fifth graders create data graphs using Microsoft Excel. In this data collection lesson plan, 5th graders create and conduct a survey, then use Excel to organize and graph their data.
Curated OER
Are We Couch Potatoes or Busy Bees? Data Analysis of Physical Activity in School
Students study practical data analysis within the constraints of the scientific method. In this data lesson students collect and enter data into a computer spreadsheet then create graphs.
Raytheon
Data Analysis and Interpretation
For this data analysis and interpretation worksheet, learners use charts, graphs, statistics to solve 42 pages of problems with answer key included.


